Figure 1.

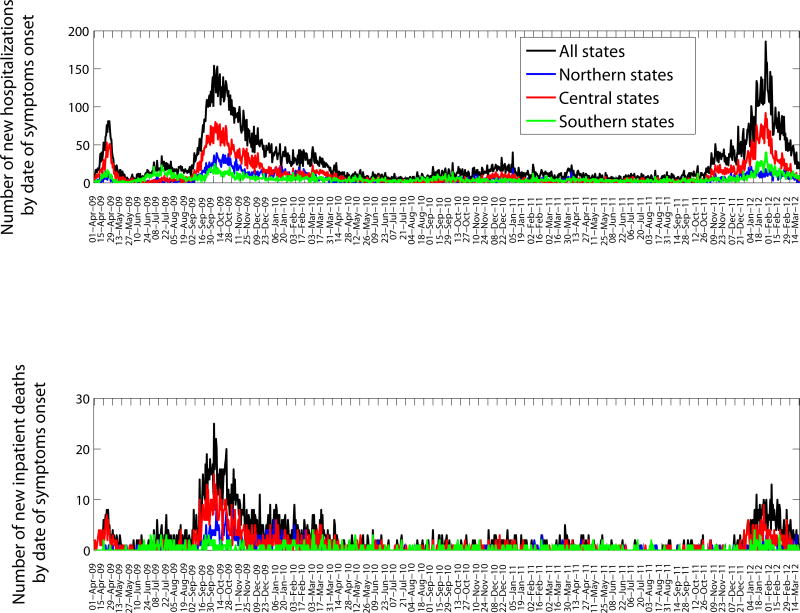
Daily epidemic curves of all SARI hospitalizations (top) and deaths (bottom) according to dates of symptom onset in northern, central, and southeastern states of Mexico (April 1, 2009–March 20, 2012).

Daily epidemic curves of all SARI hospitalizations (top) and deaths (bottom) according to dates of symptom onset in northern, central, and southeastern states of Mexico (April 1, 2009–March 20, 2012).