
Figure 4. Pathway enrichment analysis of pair-wise comparisons between major developmental hematopoietic groups.
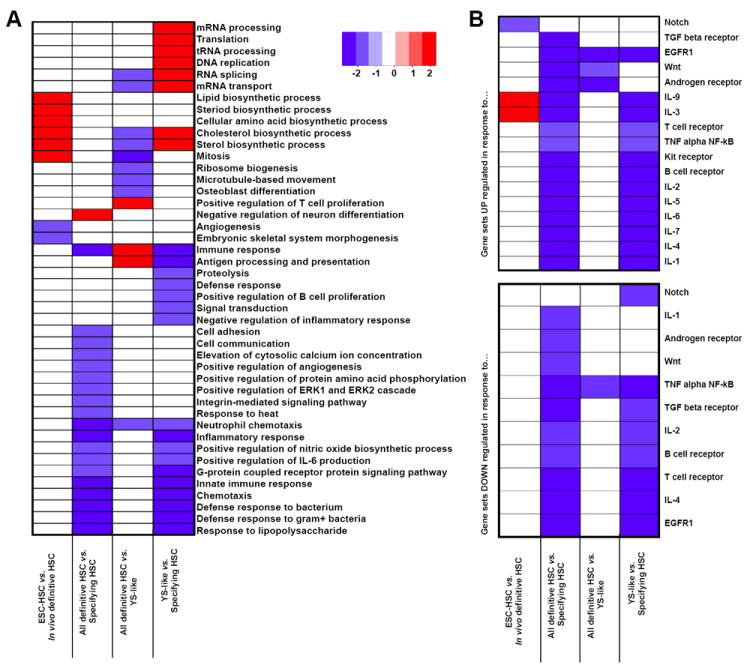
(A) GSEA of pair-wise comparisons to find GO Biological Processes enriched (red) or depleted (blue) between developmental populations. (B) GSEA of pair-wise comparisons to identify NetPath-annotated signaling pathways transcriptionally activated or suppressed. “In vivo Definitive HSC” includes WBM, FL12 F, E13.5 FL and E14.5 FL; “Specifying HSC” includes AGM, FL12 A, and placenta; “YS-like” includes EB and YS; and “All definitive HSC” includes ESC-HSC, WBM, FL12 F, E13.5 FL and E14.5 FL. Only significant gene sets are shown (Family wise error rate<0.05). See also Figure S4.