
Figure 6. Identification and validation of novel transcriptional regulators of discrete stages of HSC ontogeny.
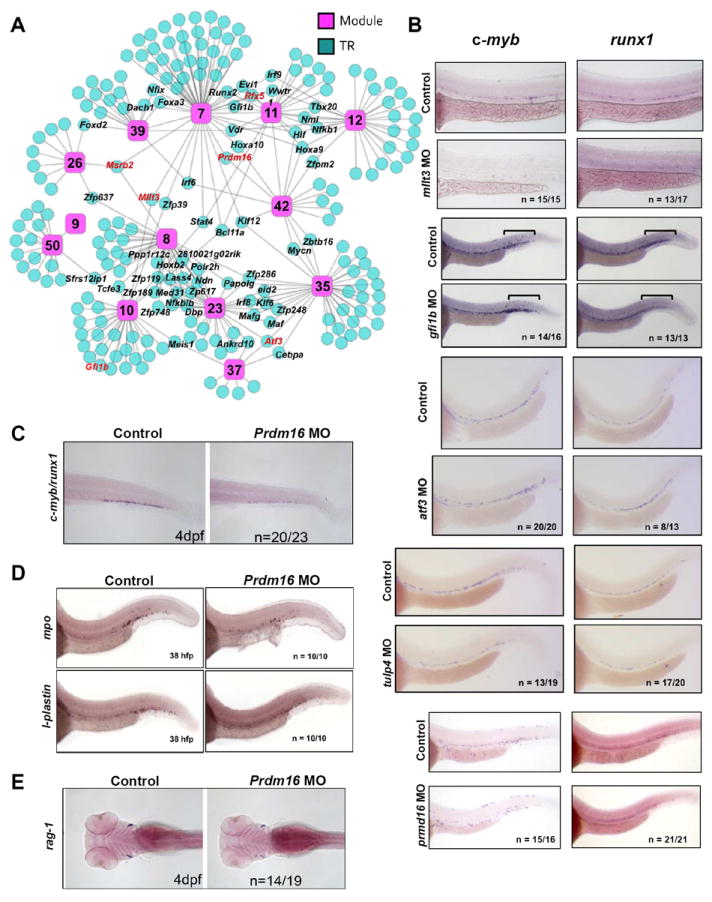
(A) CLR was applied to identify putative TRs for each module. A network schematic of the CLR-derived predictions at the 0.05 FDR for all “Definitive HSC” modules is shown. Pink squares represent modules and blue circles represent predicted TRs. “Hub” genes are labeled black. Genes assessed functionally in zebrafish are highlighted in red. A list of all genes predicted to regulate each module can be found at http://hsc.hms.harvard.edu/. (B) Whole-mount in situ hybridization for c-myb and runx1 was performed at 36 hpf on uninjected embryos or embryos injected with morpholinos (MO) targeting mllt3, gfi1, atf3, tulp4, or prdm16. Bars in gfi1b panels designate the posterior ICM. (C) The CHT of prdm16 morphants was examined 4 dpf for c-myb/runx1 expression via whole-mount in situ hybridization. (D) Prdm16 morphants were examined via whole-mount in situ hybridization for mpo or l-plastin expression at 38 hpf. (E) Prdm16 morphants were examined via whole-mount in situ hybridization for rag-1 at 4 dpf. See also Figures S6, S7.