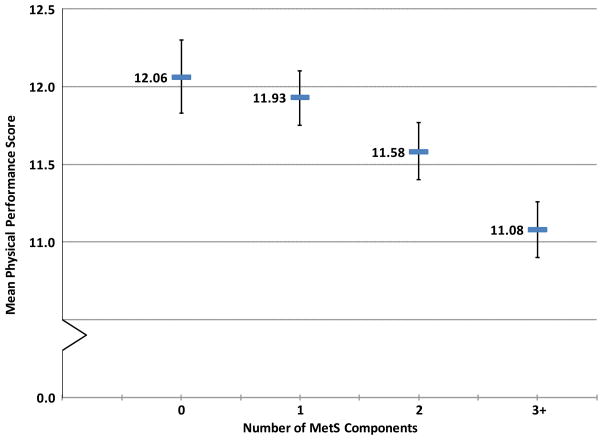
Figure 1.

Mean Physical Performance Score By Number of Metabolic Syndrome (MetS) Components. The bars show mean physical performance scores and error bars represent the 95% Confidence Interval (CI) for 5,457 men with 0 (n=901), 1 (n=1,614), 2 (n=1,447) or 3 or more MetS components (n=1,495). MetS components include insulin resistance (impaired fasting glucose (100 to <126 mg/dL), diabetes (fasting glucose 126 mg/dL or greater, a history of diabetes, or use of hypoglycemic medications) or hyperinsulinemia (top quartile of fasting insulin among non-diabetic men) systolic blood pressure of 140 mmHg or higher or use of anti-hypertensive medication; triglycerides of 150 mg/dL or higher; high density lipoprotein cholesterol <35 mg/dL; and body mass index of 30 kg/m2 or greater. Graphed values are least square means and 95% CI from a regression model adjusted for age, race, clinic site, smoking, alcohol consumption, physical activity, history of falls/fractures, self-rated health, and number of chronic conditions. Physical performance scores ranged from 1–20, with higher scores indicating better performance. Means (95% CI) for the four groups were 12.06 (11.83–12.30), 11.93 (11.75–12.10), 11.58 (11.40–11.77), and 11.08 (10.90–11.26), respectively. The trend across categories was significant (P<.001).
