
Figure 6.
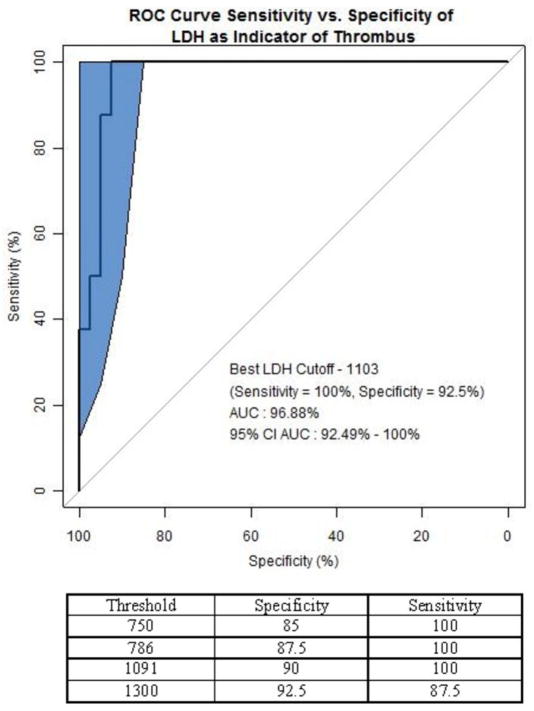
Roc Curve Analysis of LDH as Indicator of Device Thrombosis
The specificity and sensitivity values for LDH as an indicator for thrombosis were identified from the ROC curve. An LDH value above 750 u/mL has a specificity of 85% and should trigger further evaluation for device thrombosis diagnosis. The optimal results were achieved with an LDH cutoff of 1103 u/mL.
The blue region of the graph represents a 95% confidence interval for the ROC curve using the bootstrap method in the pROC package11 in R version 2.15.0.