
Figure 6.
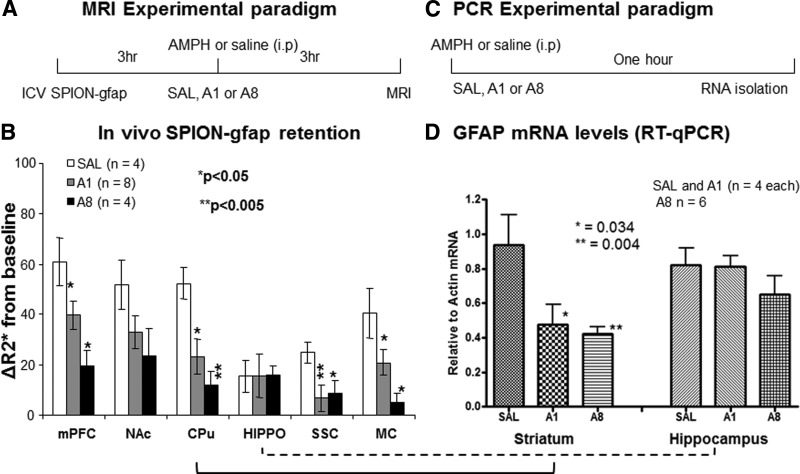
Amphetamine-induced changes in GFAP mRNA expression by GT tMRI and RT-PCR. At 2 wk before MRI, 6 mice were given saline (n=4) or amphetamine (4 mg/kg, i.p., n=2) injections, once every other day for a total of 7 doses. On the day of MRI, we administered SPION-gfap to all 6 mice. After 3 h, we subdivided the 4 mice in the saline group, and injected them with saline (SAL group; n=2) or amphetamine (A1 group; acute exposure, n=2); the animals in the chronic exposure paradigm (A8 group) were administered one final amphetamine dose (30); there was no drug withdrawal period in this study. We then acquired R2* maps of the brains 3 h later (i.e., 6 h after i.c.v.), as described herein for optimal CNR, the earliest time point for sufficient SPION-gfap MR signal specificity. The entire protocol was repeated, as determined by power analysis (P=80%; α=0.05) of the data from the first MRI. A) MRI paradigm used on the day of experiment. B) Changes in ΔR2* after amphetamine showed differential decrease across the SAL, A1, and A8 groups in all brain regions except hippocampus (hippo). C) Experimental paradigm used on the day of ex vivo gene activity measurements. D) RT-PCR of GFAP mRNA collected 30 min after amphetamine showed significant reduction in gfap mRNA levels in the striatal regions (CPu), but not in hippocampus; this was true for all paradigms. Means and se (error bars) from each group are shown. Western blotting showed a slightly, but not significant elevation of striatal GFAP levels in A1 group (n=3) and A8 group (n=5) (Supplemental Fig S6).