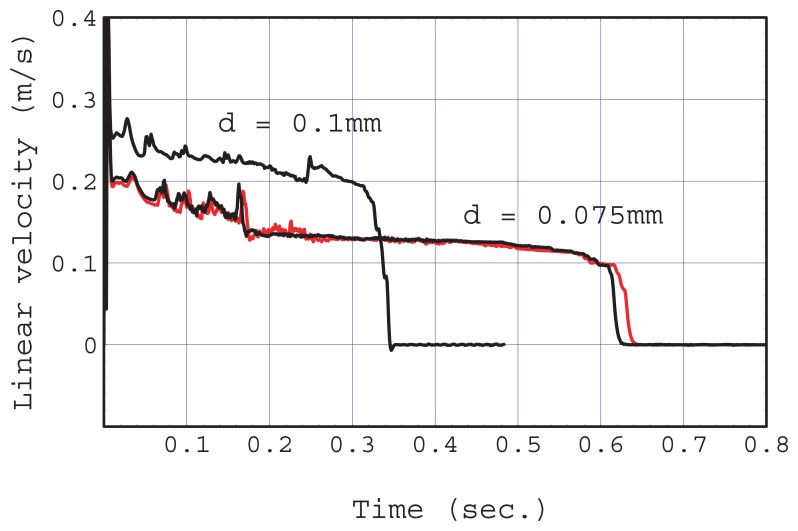
Figure 6.
Linear velocity profiles at a height of d/2 from the bottom in the region of the detection area obtained by simulations. The flow rate fluctuation was confined to the second stage (before 0.17 s) and after that a quasi-steady flow was observed with the fluidic chip where d < rc, (d = 0.075 mm, black). Simulation conditions were the same except that the gravitational acceleration constant was zero (red). The flow rate fluctuation remained for almost the entire period and the flow rate decreased slightly (d = 0.1 mm).

