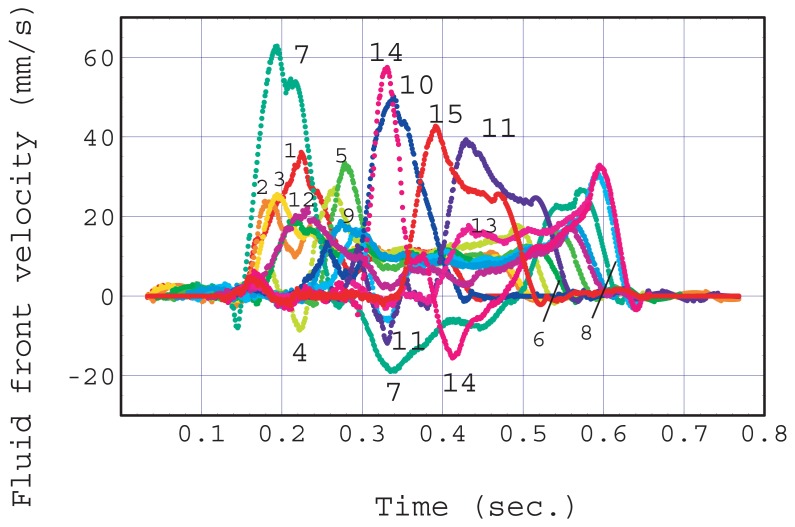
Figure 8.
Velocity of fluid front in each capillary calculated using the data in Figure 5(A). A negative velocity indicates the pullback phenomenon. Capillaries #4, 11, 7 and 14 exhibit their maximum negative velocity at 0.22, 0.33, 0.34, and 0.41 s, respectively.

