
Figure 5.
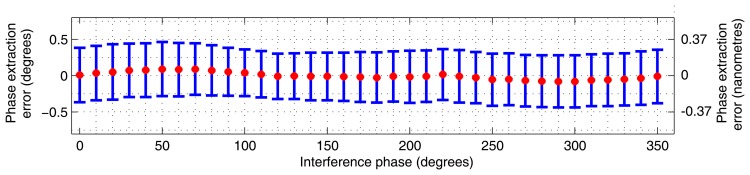
Experimental results: the red points show the periodic error, i.e., the dependence of the mean phase determination error on immediate interference phase; the blue error bars indicate the interval of radius of standard deviation around the mean PDE at each corresponding point i (ni ≈ 1,485)