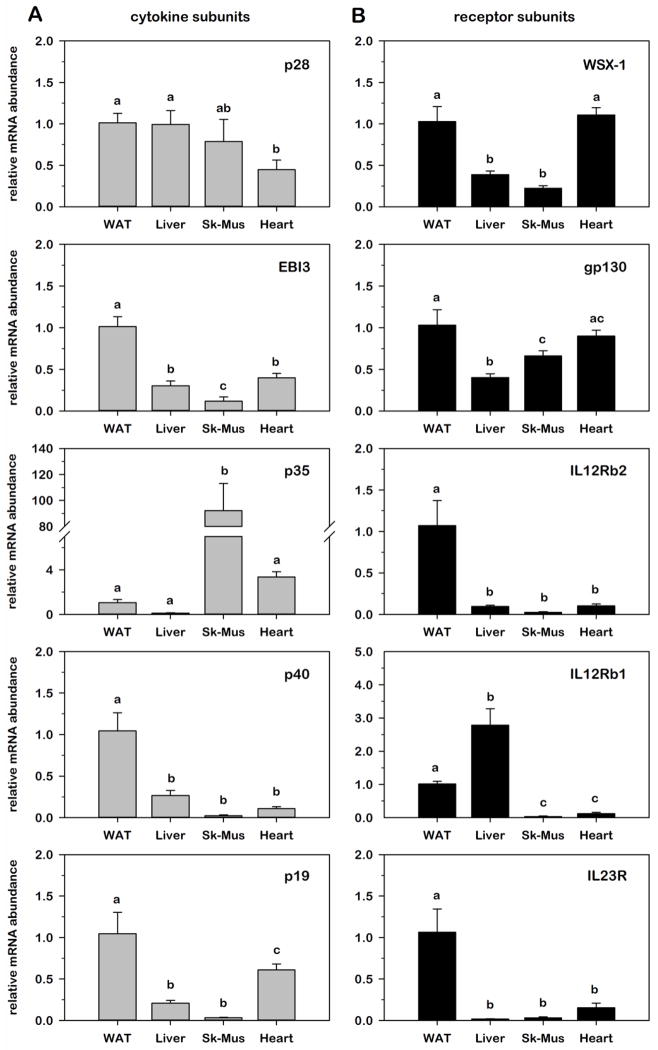
Fig. 2. Relative IL-12 family cytokine and receptor gene expression across insulin-responsive tissues from lean C57BL/6J mice.
Relative mRNA abundance of ligand (A) and receptor (B) subunits was determined by qRT-PCR from total RNA extracted from epididymal white adipose tissue (WAT), liver, calf skeletal muscle, and heart of 10 wk old lean C57BL/6J mice. Data were normalized to 18S and expressed as fold differences relative to WAT. Statistical differences were determined by ANOVA, with Tukey’s post-hoc analysis performed when the p-value for the respective parameter was statistically significant (p < 0.05).

