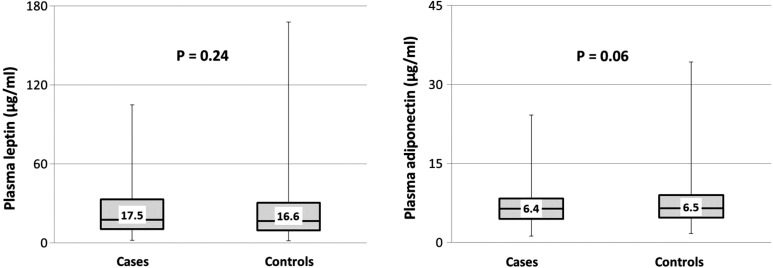
Figure 1.
Absolute levels of leptin and adiponectin in endometriosis cases and controls. Absolute levels of leptin and adiponectin expressed in µg/ml among 350 case and 694 control subjects in the NHS II cohort. Box denotes median with inter-quartile range (Q1–Q3). Whiskers represent the minimum and maximum values. P-values compare absolute adipokine levels between case and control subjects and were calculated using mixed effect models.

