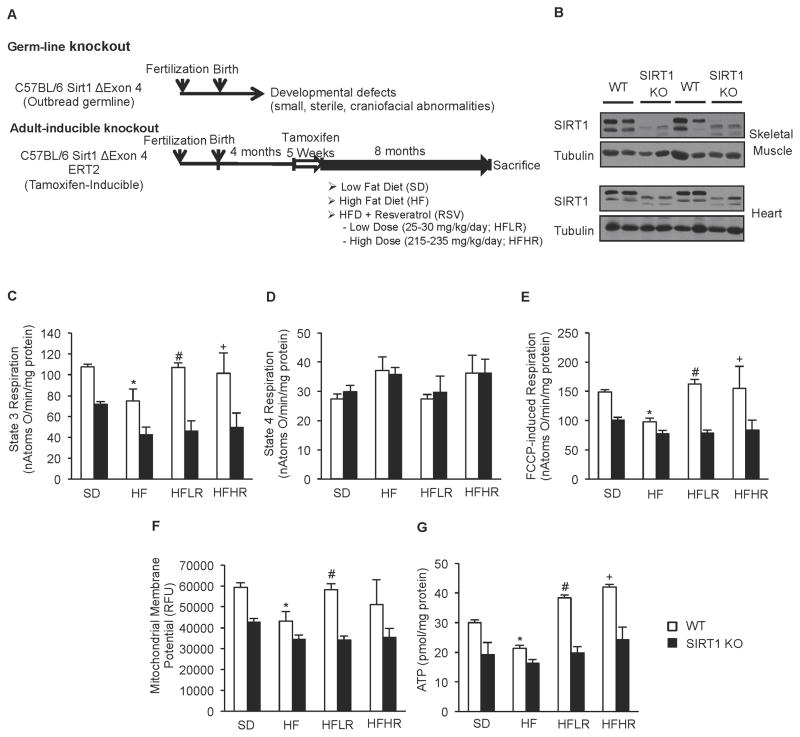
Figure 2. Generation of adult inducible SIRT1 KO mice revealed that ability of resveratrol to improve mitochondrial function requires SIRT1 in vivo.
(A) Schematic representation of induction of SIRT1 KO and treatment with the different diets.
(B) Representative immunoblot for SIRT1 and tubulin in skeletal muscle and heart of WT and SIRT1 KO mice.
(C) State 3 respiration of isolated mitochondria from skeletal muscle of WT and SIRT1 KO mice on experimental diets (n=8) (*p<0.05 versus WT SD, #p<0.05 versus WT HFD).
(D) State 4 respiration of isolated mitochondria from skeletal muscle of WT and SIRT1 KO mice on experimental diets (n=8)
(E) FCCP-induced respiration of isolated mitochondria from skeletal muscle of WT and SIRT1 KO mice on experimental diets (n=8) (*p<0.05 versus WT SD, #p<0.05 versus WT HFD).
(F) Mitochondrial membrane potential of isolated mitochondria from skeletal muscle of WT and SIRT1 KO mice on experimental diets (n=8) (*p<0.05 versus WT SD, #p<0.05 versus WT HFD).
(G) Cellular ATP content from gastrocnemius of WT and SIRT1 KO mice on experimental diets (n=8) (*p<0.05 versus WT SD, #p<0.05 versus WT HFD, +p<0.05 versus WT HFD).

