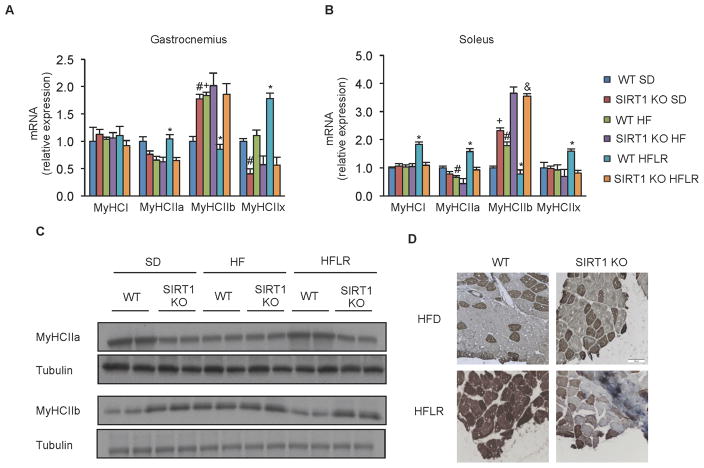
Figure 3. Resveratrol induces a shift toward more oxidative fibers in a SIRT1 dependent manner.
(A–B) MyHCI, MyHCIIa, MyHCIIb and MyHCIIx mRNA analyzed by quantitative RT-PCR in gastrocnemius (A) and soleus (B) of WT and SIRT1 KO mice on experimental diets. Relative expression values were normalized to WT SD mice (n=4) *p<0.05 versus WT HFD, #p<0.05 versus WT SD, +p<0.05 versus WT SD).
(C) Representative immunoblot for MyHCIIa, MyHCIIb and tubulin in gastrocnemius of WT and SIRT1 KO mice on experimental diets.
(D) Representative MyHCIIa immunostaining in gastrocnemius of WT and SIRT1 KO mice on experimental diets.
Values are expressed as mean ± SEM.

