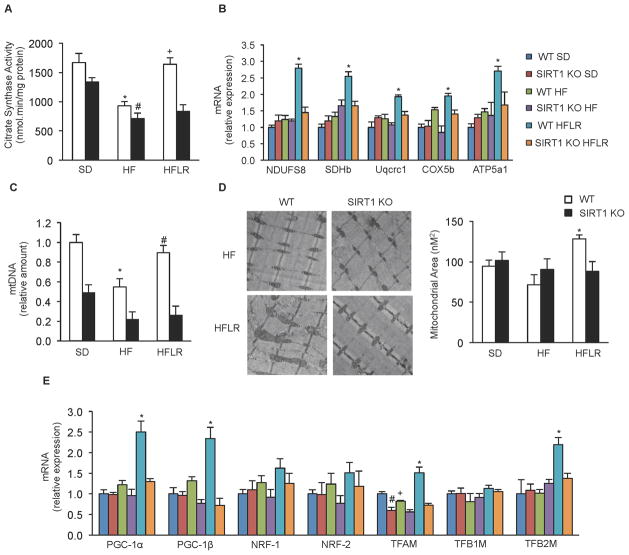
Figure 4. Resveratrol improves mitochondrial biogenesis in skeletal muscle of WT but not SIRT1 KO mice.
(A) Citrate synthase activity measured in gastrocnemius from WT and SIRT1 KO mice on experimental diets (n=8) (*p<0.05 versus WT SD, #p<0.05 versus SIRT1 KO SD, +p<0.05 versus WT HFD).
(B) NDUFS8, SDHb, Uqcrc1, COX5b and ATP5a1 mRNA analyzed by quantitative RT-PCR in gastrocnemius of WT and SIRT1 KO mice on experimental diets. Relative expression values were normalized to WT SD mice. (n=4 experiments *p<0.05 versus WT HFD).
(C) Mitochondrial DNA content analyzed by quantitative PCR in gastrocnemius of WT and SIRT1 KO mice on experimental diets. Relative expression values were normalized to WT SD mice. (n=8 experiments *p<0.05 versus WT SD, #p<0.05 versus WT HFD).
(D) Electronic microscopy analysis of gastrocnemius from WT and SIRT1 KO mice on experimental diets and the respective mitochondrial area quantification (n=4) (*p<0.05 versus WT HFD).
(E) PGC-1α, PGC-1β, NRF-1, NRF-2, TFAM, TFB1M and TFB2M mRNA analyzed by means of quantitative RT-PCR in gastrocnemius of WT and SIRT1 KO mice on experimental diets. Relative expression values were normalized to WT SD mice. (n=4) (*p<0.05 versus WT HFD, #p < 0.05 versus WT SD, +p<0.05 versus WT SD).
Values are expressed as mean ± SEM.

