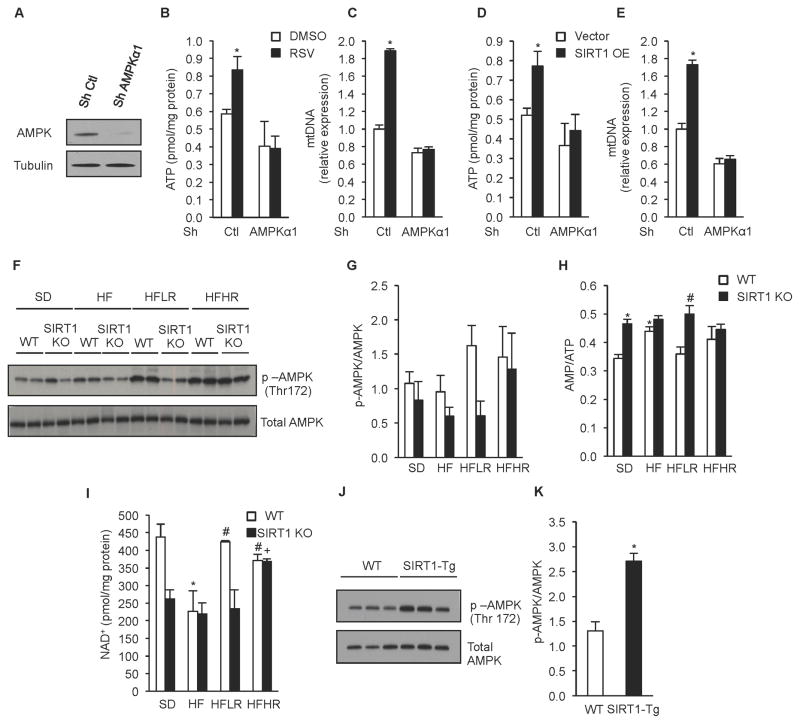
Figure 6. Resveratrol activates AMPK through SIRT1 dependent and independent mechanisms depending on dose.
(A) Representative immunoblot for AMPKα and tubulin in C2C12 cells infected with AMPKα or non-targeting shRNA.
(B) ATP content in C2C12 cells infected with AMPKα or non-targeting shRNA and treated with 25 μM resveratrol for 24h (n=5) (*p<0.05 versus DMSO).
(C) Mitochondrial DNA content analyzed by quantitative PCR in C2C12 cells infected with AMPKα or non-targeting shRNA and treated with 25 μM resveratrol for 24h. Relative expression values were normalized to WT. (n=5) (*p<0.05 versus DMSO).
(D) ATP content in C2C12 cells infected with AMPKα or non-targeting shRNA and treated with adenovirus overexpressing SIRT1 or empty vector (n=5) (*p<0.05 versus empty DMSO).
(E) Mitochondrial DNA content analyzed by quantitative PCR in C2C12 cells infected with AMPKα or non-targeting shRNA and with adenovirus overexpressing SIRT1 or empty vector. Relative expression values were normalized to control. (n=5) experiments (*p<0.05 versus empty DMSO).
(F) Representative immunoblot for p-AMPK (Thr172) and total AMPK in gastrocnemius of WT and SIRT1 KO mice on experimental diets.
(G) Quantification of AMPK activity evaluated by the ratio of p-AMPK and AMPK in gastrocnemius of WT and SIRT1 KO mice on experimental diets (n=8).
(H) NAD+ content in gastrocnemius of WT and SIRT1 KO mice on experimental diets (n=4) (*p<0.05 versus WT SD, #p<0.05 versus WT HF, +p<0.05 versus SIRT1 KO HF). (J) Representative immunoblot for p-AMPK (Thr172), and total AMPK in gastrocnemius of WT and SIRT1 Tg mice.
(K) Quantification of AMPK activity evaluated by the ratio of quantification of p-AMPK and AMPK in gastrocnemius of WT and SIRT1 Tg mice (n=6) (*p<0.05 versus WT).
Values are expressed as mean ± SEM.

