
Figure 1. Mutational Complexity of Acute Myeloid Leukemia (AML).
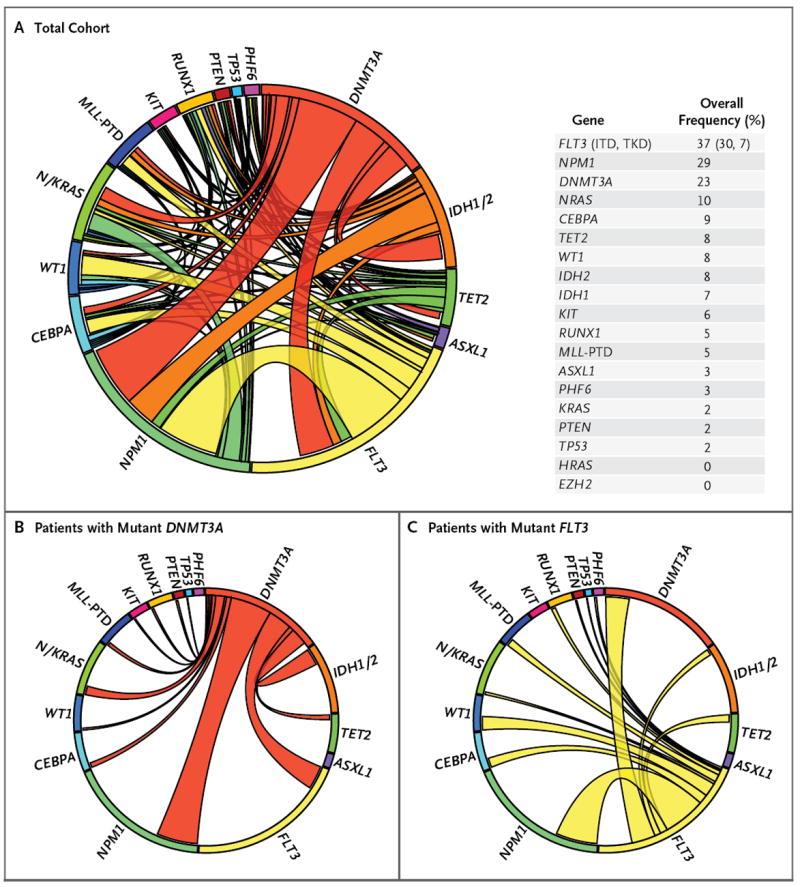
A Circos diagram (Panel A) depicts the relative frequency and pairwise co-occurrence of mutations in patients with newly diagnosed AML who were enrolled in the Eastern Cooperative Oncology Group E1900 clinical trial. The length of the arc corresponds to the frequency of mutations in the first gene, and the width of the ribbon corresponds to the percentage of patients who also had a mutation in the second gene. Pairwise co-occurrence of mutations is denoted only once, beginning with the first gene in the clockwise direction. Panel A also shows the frequency of mutations in the test cohort. Panels B and C show the mutational events in patients with mutant DNMT3A and mutant FLT3, respectively. Since, for clarity, only pairwise mutations are encoded, the arc length was adjusted to maintain the relative size of the arc, and the correct proportion of patients with only a single mutant allele is represented by the not-otherwise-occupied space within each mutational subset (all panels). ITD denotes internal tandem duplication, PTD partial tandem duplication, and TKD tyrosine kinase domain.