
Figure 3. Revised Risk Stratification of Patients with AML on the Basis of Integrated Genetic Analysis.
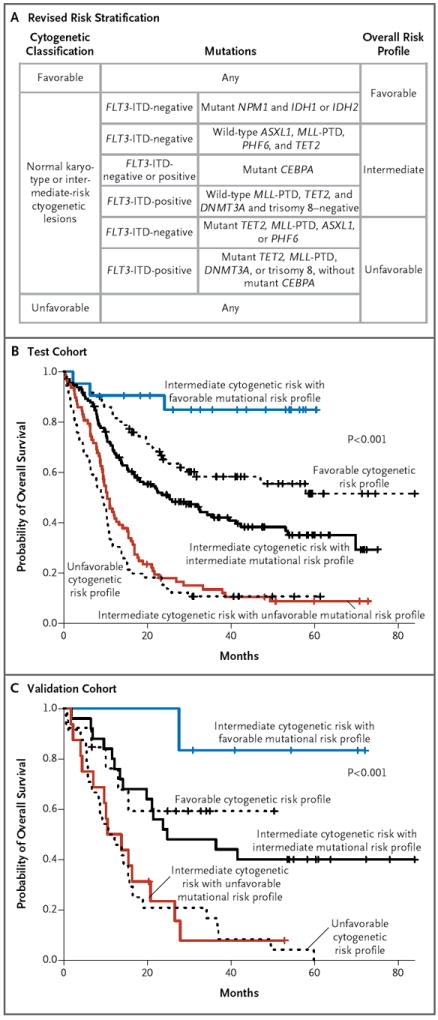
Panel A shows a revised risk stratification on the basis of integrated cytogenetic and mutational analysis. The final overall risk groups are shown on the right. Panel B shows the effect of integrated mutational analysis on risk stratification in the test cohort of patients with AML (with P values for the comparison of all curves), and Panel C shows the reproducibility of the genetic prognostic schema in an independent cohort of 104 patients from the E1900 trial (with P values for the comparison of all curves). In Panels B and C, the black curves show the patients whose risk classification remained unchanged, the blue curve shows patients who were reclassified from intermediate risk to favorable risk, and the red curve shows patients who were reclassified from intermediate risk to unfavorable risk.