
Figure 4. Molecular Determinants of Response to High-Dose Daunorubicin Induction Chemotherapy.
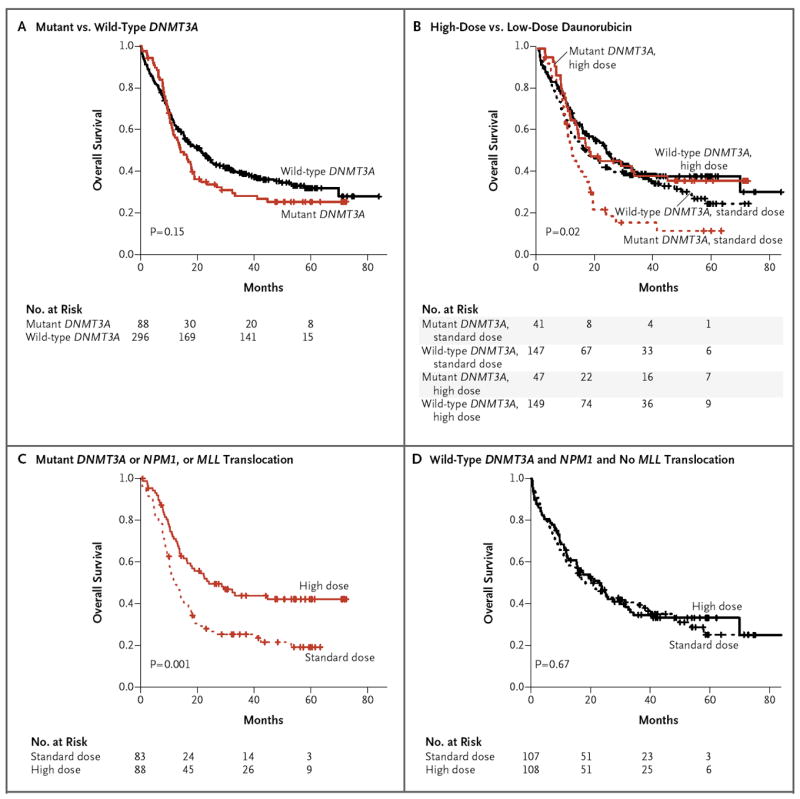
Kaplan–Meier estimates of the probability of overall survival are shown in the entire cohort according to DNMT3A mutational status (Panel A) and according to DNMT3A status and receipt of high-dose or standard-dose daunorubicin (Panel B). The P value in Panel B is for the comparison across all groups. The rates of overall survival according to receipt of high-dose or standard-dose daunorubicin are shown among patients with DNMT3A or NPM1 mutations or MLL translocations (Panel C) and among patients without DNMT3A and NPM1 mutations and with no MLL translocations (Panel D).