
Fig. 2.
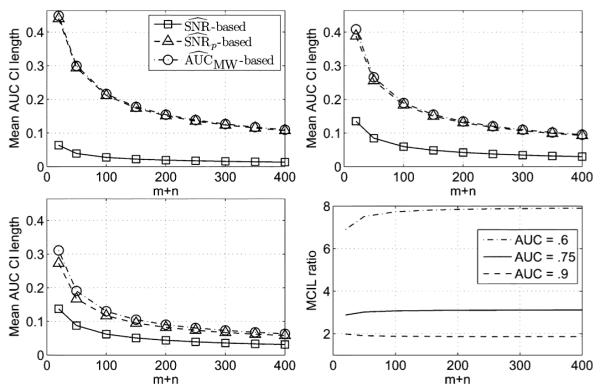
Mean 95% AUC confidence interval length plotted versus m + n with m = n and ω1 = ω2 = 0.025. The plots correspond to true AUC values of 0.6 (top left), 0.75 (top right), and 0.9 (bottom left). (bottom right) The ratio of the MCIL to the MCIL plotted versus m + n for AUC = 0.6, 0.75, and 0.9.