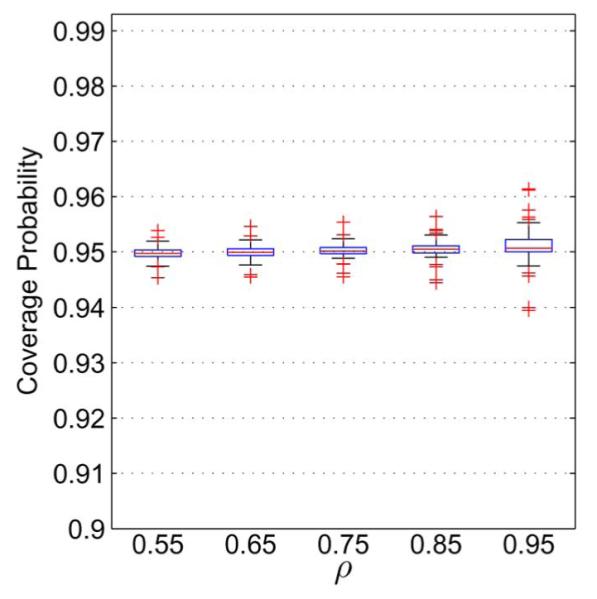
Fig. 3.

Box plots displaying the estimated coverage probability of approximate 95% confidence intervals for AUCA – AUCB with m = n = 50. Each box plot corresponds to one value of ρ, and summarizes the coverage probability for 81 combinations of AUC values, with AUCA, AUCB ∈ {0.55, 0.60, 0.65, 0.70, 0.75, 0.80, 0.85, 0.90, 0.95}.
