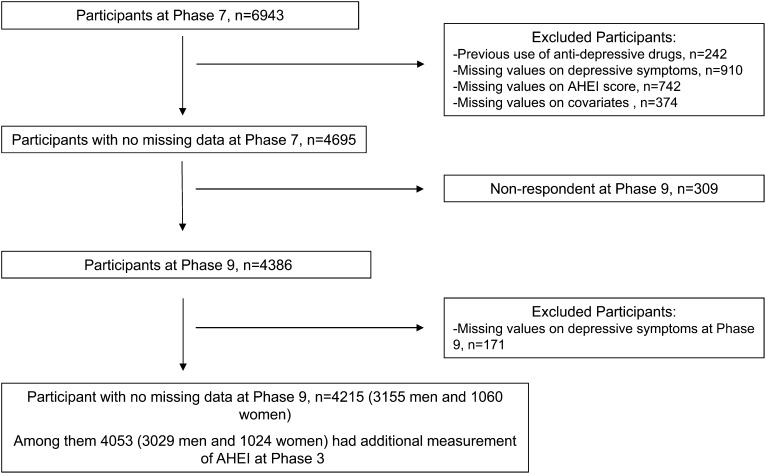
FIGURE 1.
Derivation of the analytic sample. Compared with participants excluded from the current analytic sample (n = 2728), included participants (n = 4215) were more likely to be men, white, younger, and with a high socioeconomic status (all P < 0.001) and less likely to report recurrent depressive symptoms (P < 0.001). Furthermore, a higher mean total energy intake (P < 0.001) and AHEI score (P < 0.001) were observed in included than excluded participants because of missing data on depressive symptoms or covariates. AHEI, Alternative Healthy Eating Index.

