
FIGURE 5.
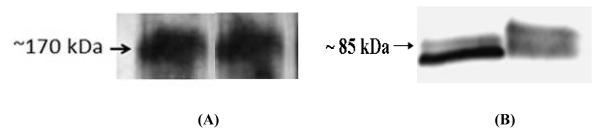
Western blot analysis of P-gp (A) and PepT-1 (B) expression in mitochondrial fraction of rPCECs. (A) The proteins were stained with MDR-1 goat polyclonal antibodies. Lanes 1 (left) and 2 (right): 75 and 100 μg/μL mitochondrial protein fractions from rPCECs respectively. (B) The proteins were stained with PepT-1 rabbit polyclonal antibodies. Lanes 1 (left) and 2 (right): 25 and 50 μg/μL mitochondrial protein fractions from rPCECs respectively.