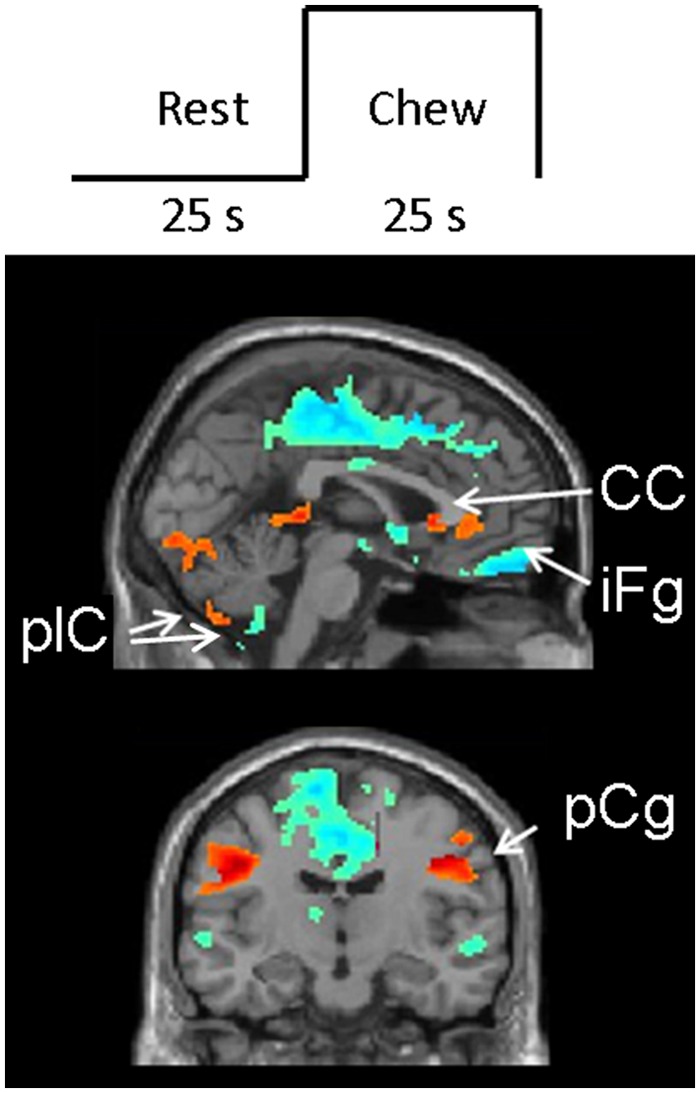
Figure 1.

Block design and results. (top) Diagrammatic depiction of the block design. (bottom) Results of the contrast between chew blocks and rest blocks. Red/yellow areas show increased activations during chew-blocks relative to successive rest blocks; blue/green areas show decreased activations during chew-blocks relative to successive rest blocks. Note that both hyper- and hypo-activations occur in the posterior lobe of the left cerebellum; also see Table. CC = corpus callosum; plC = cerebellum posterior lobe; iFg = inferior frontal gyrus; pCg = pre-central gyrus.
