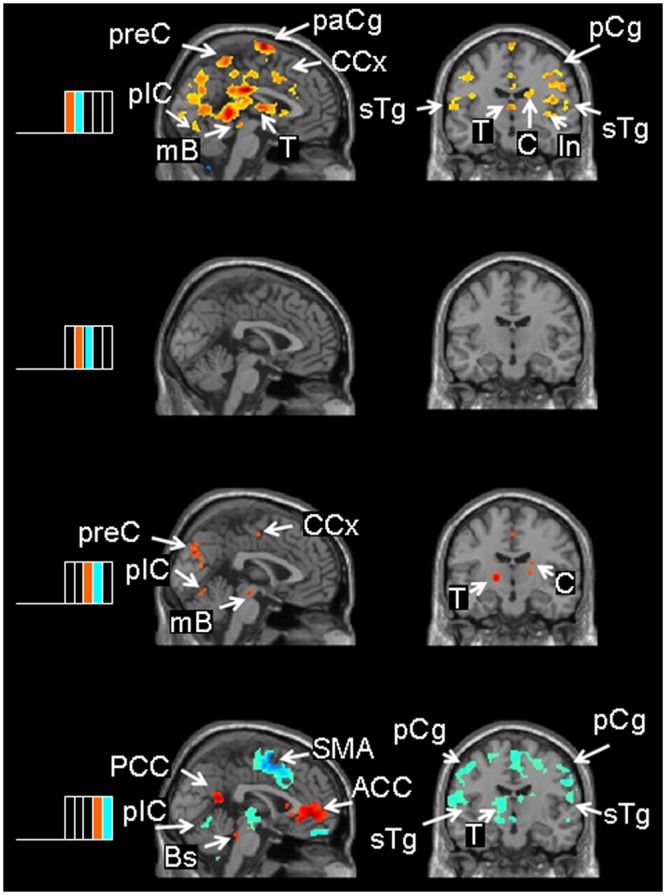
Figure 3.

Contrasts between successive chew-block segments. The left side of the Fig. shows the 2 successive chew-block segments depicted in the adjacent brain slices. Note the color coding: Red/yellow areas show where brain activity was higher in a given segment relative to the ensuing segment; blue/green areas show areas where brain activity was higher in a given segment relative to the preceding segment. The first contrast (1/5 – 2/5) shows the brain activations during the initiation of the chew block. The other contrasts show brain activity during sustained chewing. ACC = anterior cingulate cortex; Bs = brainstem; C = caudate nucleus; CCx = cingulate cortex; In = insula; mB = midbrain; PCC = posterior cingulate cortex; pCg = pre-central gyrus; plC = cerebellum, posterior lobe; paCg = paracentral gyrus; preC = precuneus; sTg = superior temporal gyrus; T = thalamus.
