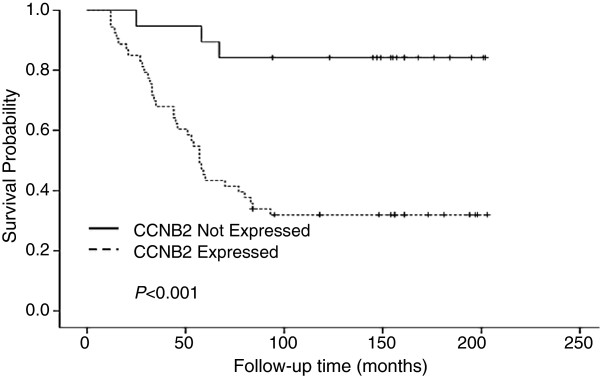
Figure 2.

Kaplan-Meier curves illustrating the effect of CCNB2 expression on disease specific survival in breast cancer. Dashed line represents patients whose tumors over-expressed CCNB2 and solid line represents patients whose tumors did not. The p-values for the difference between the curves were calculated using log-rank test.
