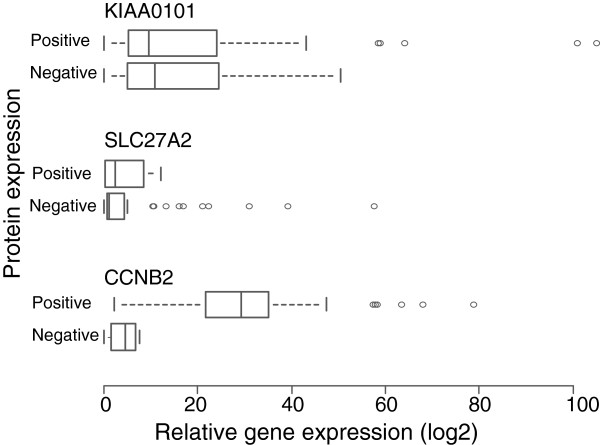
Figure 5.
The association of CCNB2, KIAA0101, and SLC27A2 mRNA levels to their corresponding protein levels in breast cancer patients. The box plots Positive and Negative indicate corresponding gene expression levels for each protein. The mRNA expression of CCNB2 was consistent with the IHC findings. There was no relationship between KIAA0101 and SLC27A2 mRNA with their corresponding protein expression.

