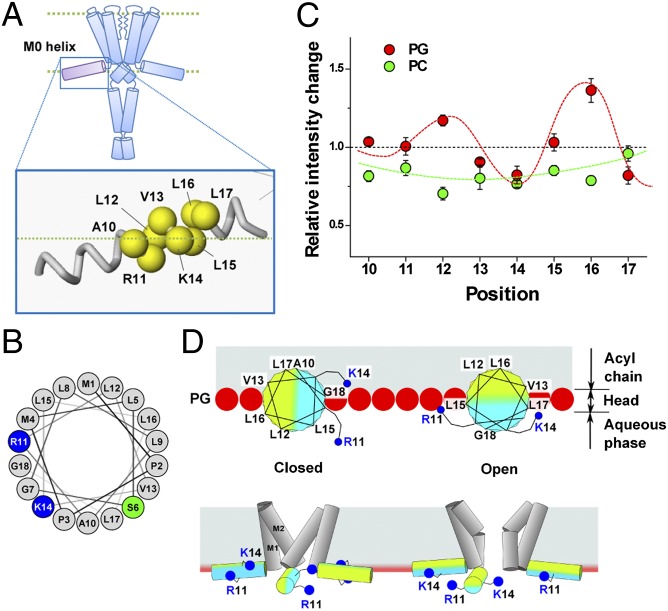
Fig. 4.
Conformational changes of the M0 helix upon gating via a monitoring of the fluorescence signal. (A) TMR-labeled sites on the M0 helix. (B) Helical wheel projection of the M0 helix (residues 1–18). (C) Relative intensity changes of the TMR at pH 4.0 and pH 7.5. Red and green circles indicate the results in the PG and PC liposomes. Red curve delineates the periodic changes, with 3.6 aa per turn. This periodicity is typical of an α-helix. Fluorescence values were standardized by means of a control sample (56-TMR) for each lipid condition. Error bars represent ±SD (n = 3–7). (D) Roll-and-stabilize model. (Upper) Helical wheel in the C-terminal half of the M0 helix located at the membrane interface as viewed from the N-terminal side. In the PG membrane, K14 and L17 are exposed to the aqueous environment in the open state, whereas L12 and L16 are turned to the hydrophobic milieu. Red spheres represent the negatively charged head groups of PG, and blue dots represent the positively charged head of the amino acid residues (R11 and K14). (Lower) Amphipathic M0 helix, represented by two-color rods, revolves around the axis by ∼90° upon gating, and the positively charged residues (R11 and K14) interact with the negative head groups of the lipids.

