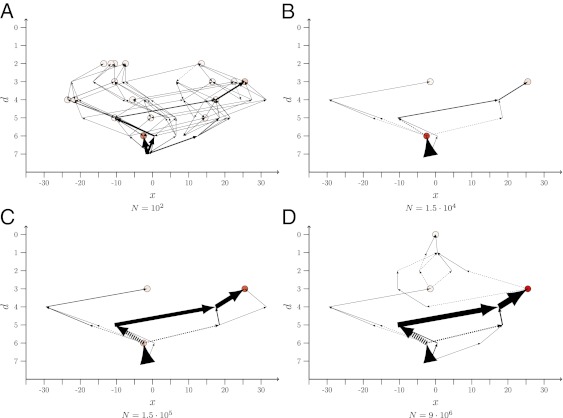
Fig. 1.
Arrow plots of LODs obtained from an ensemble of 1,000 runs over T = 215 = 32,768 generations, starting from genotype 250 of the empirical A. niger dataset. Population size N varies from 102 in A to 9⋅106 in D, and the mutation rate is μ = 10−5. The possible states (genotypes) are ordered such that the abscissa provides the Hamming distance, d, of a genotype to the global optimum (GO), which is located at the origin. The Hamming distance is the number of single mutational steps separating two genotypes. States with the same d are distributed equidistantly along the horizontal direction. The circles represent endpoints of paths; the darker their filling, the more often the corresponding state was the most populated one at final time T. The thicknesses of the arrows are directly proportional to the fraction of times a certain step has been taken when the numerical experiment was repeated. The arrows always point from the ancestor to the descendant. The lines with arrows at both ends mean that the step was taken in both directions, although not necessarily in the same realization. The dashed arrows indicate that the descendant’s fitness is lower than that of the ancestor.

