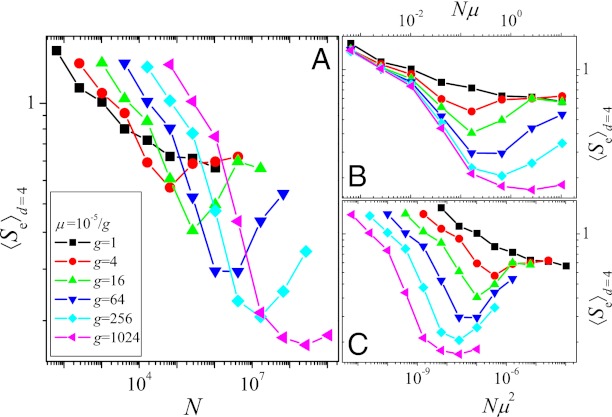
Fig. 2.
(A) Entropy with respect to endpoints, 〈Se〉d=4, vs. population size. (B and C) Same as A but entropy is plotted vs. Nμ and Nμ2, respectively. Each curve was obtained from simulations covering T = 215 generations and averaged over the 46 different possible starting points with Hamming distance d = 4 from the GO, with 100 independent runs from each starting point. Mutation rates vary between μ = 10−5 and 10−5/210 ∼ 10−8.

