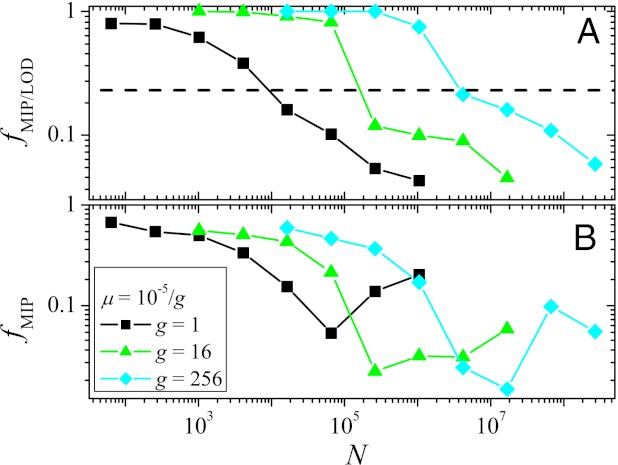
Fig. 4.
(A) The fraction of MIPs among all paths observed in 100 runs from each of the 46 viable starting genotypes at distance d = 4 from the GO that reach the GO within T = 215 generations is plotted vs. N. The horizontal dashed line shows the expected fraction if all paths occurred with equal probability. (B) Fraction of observed MIPs among all possible MIPs as a function of N. In both panels, averages are taken over starting points for which at least one MIP exists. The poor statistics are due to the fact that, in general, only a few MIPs are observed.

