Fig. 2.
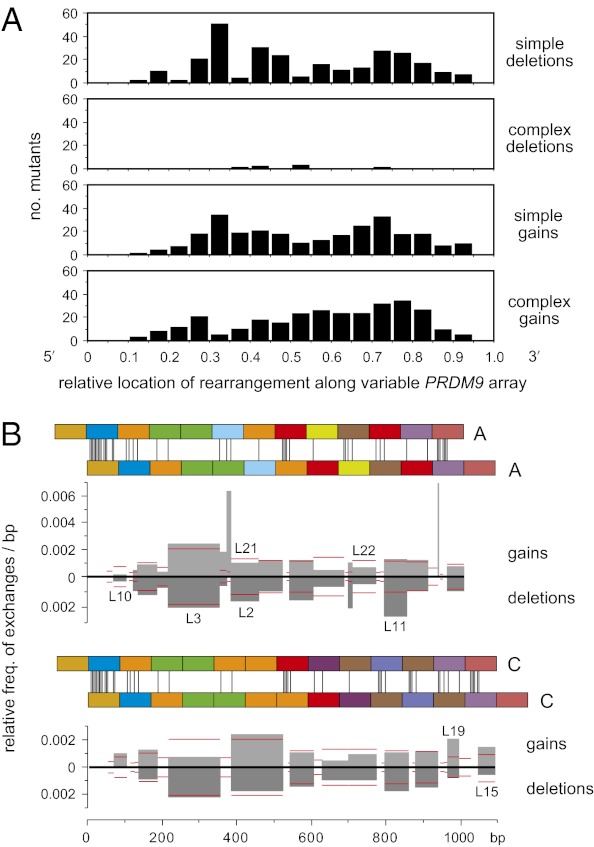
Distribution of rearrangements along the PRDM9 ZnF coding repeat array. (A) Distribution of rearrangement midpoints as a proportion of progenitor array length. Data were pooled over all sequenced mutants and binned into 0.05 intervals. Only the complex gains showed evidence for polarity, with 65% (193/298) of midpoints located 3′ to the center of the unstable region of the array (χ2 test, P < 0.0001). (B) Unequal exchange activity per base pair in each interval of perfect sequence identity (IPSI) shared by misaligned PRDM9 alleles. Pairs of A or C repeat arrays are shown misaligned by one repeat, with sequence mismatches marked by vertical lines. All simple ±1 repeat mutants derived from A or C alleles (Fig. S4) were used to estimate the exchange activity in each IPSI relative to all other IPSIs, allowing data to be pooled from different men. Thus, if 10% of mutants mapped to an IPSI 50 bp long, then the relative activity of this IPSI per base pair, relative to all other IPSIs for a given allele misalignment, was 0.1/50 = 0.002. If exchanges are randomly distributed along an array irrespective of ISPI length, then all IPSIs should show the same activity. Gain and deletion activities are shown separately, with mutants identical to known alleles indicated above and below the histograms. Following IPSI binning, the best-fit relationship between IPSI length i and the relative frequency of exchange f was f = 6 × 10⁻⁵i1.72 (Pearson's r = 0.989). This relationship was used to estimate the expected exchange activity in each IPSI (horizontal red lines). There was no significant correlation between IPSI location and the observed vs. expected exchange activity (Pearson's r = 0.175, P = 0.206), and thus no evidence that these simple exchanges are clustered toward one end of the repeat array.

