Fig. 3.
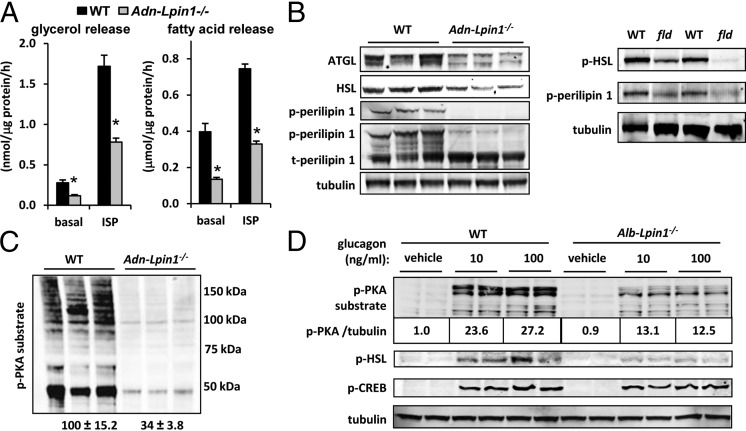
Impaired lipolysis in Adn-Lpin1−/− mice. (A) Graphs showing rates of basal and isoproterenol (ISP)-stimulated glycerol (Left) and fatty acid (Right) release by adipose tissue explants from 6- to 8-wk-old male WT and Adn-Lpin1−/− mice (n = 8 per group). *P < 0.01 vs. WT explants. (B and C) Representative Western blot images for the indicated proteins and phosphoproteins in epididymal adipose tissue of 6- to 8-wk-old male WT, Adn-Lpin1−/−, and fld mice. (D) Representative Western blot images using the indicated antibodies and lysates from hepatocytes isolated from 6- to 8-wk-old male WT and Alb-Lpin1−/− mice stimulated with the indicated concentrations of glucagon (ng/mL). The values below p-PKA substrate image represent the normalized quantification of phospho-PKA substrate blots corrected to tubulin abundance.

