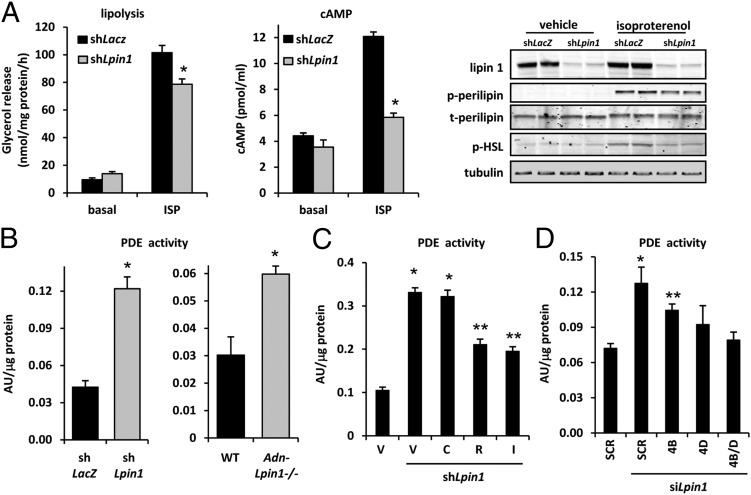
Fig. 4.
Adipocyte lipin 1 deficiency impairs lipolytic rate and enhances PDE activity. (A) (Left and Center) Graphs showing rates of basal (n = 4 per group) and isoproterenol-stimulated (n = 8 per group) glycerol release (Left) and cAMP content (Center; n = 3 per group) in 3T3-L1 adipocytes infected with adenovirus to knockdown lipin 1 (shLpin1) or control shRNA (shLacZ). *P < 0.01 vs. controls. (Right) Representative Western blot images for the indicated proteins or phosphoproteins. (B) Graphs depicting PDE activity in lysates from 3T3-L1 adipocytes infected with adenovirus to knockdown lipin 1 (shLpin1; Left) or in 6- to 8-wk-old male WT and Adn-Lpin1−/− male mice (Right). *P < 0.05 vs. controls. (C) Graph showing PDE activity in lysates from 3T3-L1 adipocytes infected with adenovirus to knockdown lipin 1 (shLpin1) and treated with vehicle (V) PDE3 (cilostamide; C), PDE4 (rolipram; R), or general PDE (IBMX; I) inhibitors (n = 6). *P < 0.01 vs. shLacZ control group; **P < 0.01 vs. shLacZ and shLpin1 DMSO groups. (D) Graph showing PDE activity in lysates from 3T3-L1 adipocytes transfected with siRNAs to knockdown lipin 1 (siLpin1), PDE4B (4B), and/or PDE4D (4D) with a scramble (SCR) siRNA control (n = 6). *P < 0.01 vs. scramble control group; **P < 0.05 vs. scramble control group and scramble control with Lpin1 siRNA.

