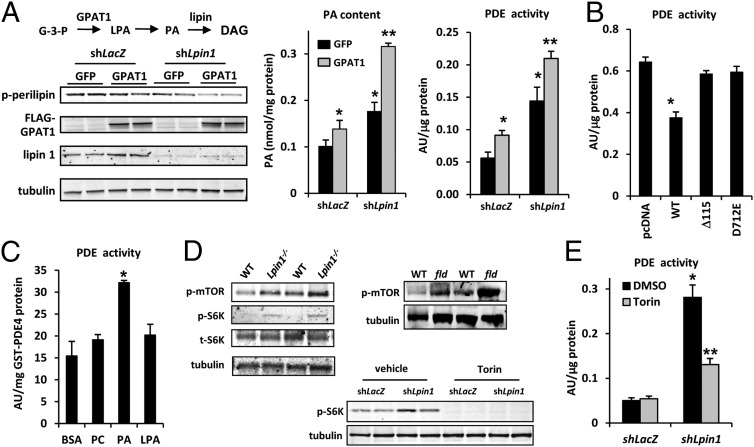
Fig. 5.
Altered PA content due to lipin 1 deficiency regulates PDE activity. (A) (Left, Upper) Schematic showing the initial steps in synthesis of glycerolipids from glycerol-3-phosphate (G-3-P). (Left, Lower) Representative Western blot images for the indicated proteins or phosphoproteins in 3T3-L1 adipocytes infected with the indicated adenovirus constructs. (Center and Right) Graphs showing the PA content (Center) and PDE activity (Right) of 3T3-L1 adipocytes infected with adenovirus to knockdown lipin 1 (shLpin1) with or without GPAT1 overexpression. *P < 0.01 vs. control group; **P < 0.01 vs. control group and P < 0.08 vs. shLpin1 alone. (B) Graph depicting PDE activity in HEK293 cells transfected with expression vectors to overexpress WT-lipin 1, Δ115-lipin 1, and lipin 1 D712E. *P < 0.01 vs. control group. (C) Graph showing PDE activity when GST-PDE4 was incubated with BSA, PC, PA, or LPA (n = 3). *P < 0.01 vs. control group. (D) Representative Western blot images for the indicated proteins or phosphoproteins in adipose tissue from 6- to 8-wk-old male WT, Adn-Lpin1−/−, and fld mice, or in 3T3-L1 adipocytes infected with adenovirus to knockdown lipin 1 or control shRNA in the presence or absence of Torin. (E) Graph showing PDE activity of 3T3-L1 adipocytes infected with adenovirus to knockdown lipin 1 (shLpin1) (or shLacZ control) in the presence or absence of Torin. n = 6. *P < 0.01 vs. control group; **P < 0.01 vs. control group and shLpin1 cells treated with DMSO.

