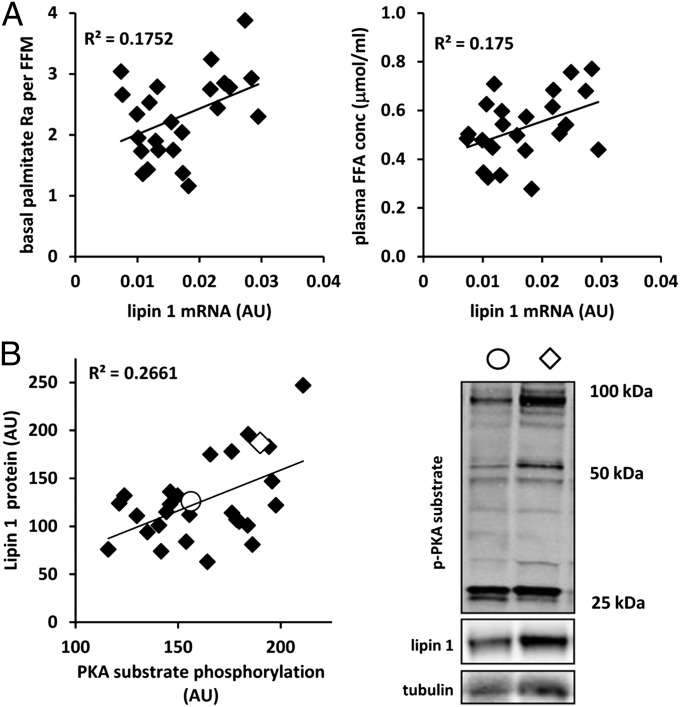
Fig. 6.
Lipin 1 expression is related to a lipolytic rates and phospho-PKA substrate abundance in obese subjects. (A) Graphs showing the relationship between the basal palmitate rate of appearance (normalized to fat-free mass) (Left) and plasma free fatty acid concentration and s.c. adipose tissue lipin 1 expression (Right) in 26 obese human subjects. (B, Left) Graph showing the relationship between s.c. adipose tissue lipin 1 protein abundance and PKA substrate phosphorylation (quantification of the three most abundant bands corrected for tubulin abundance) in 28 obese subjects as assessed by Western blot analysis. (B, Right) Representative Western blots for phospho-PKA, lipin 1, and tubulin for two subjects, indicated by open circles and diamonds on the graph.

