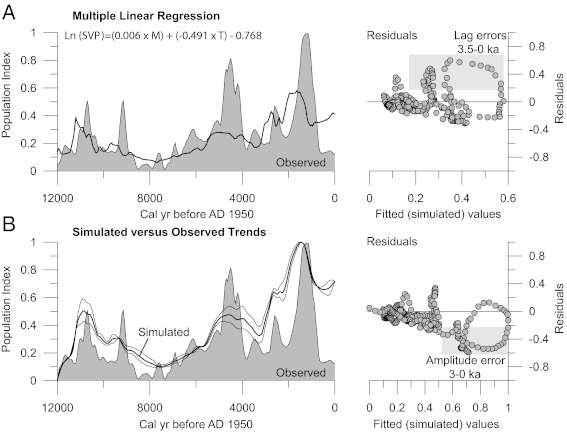
Fig. 3.
Comparison of actual and predicted radiocarbon records: (A) radiocarbon SPVs, in 50-y intervals and values predicted based on multilinear regression equation (solid line); (B) radiocarbon SPVs with predicted values based on a model of dynamic equilibrium (Eq. 4) based on lagged population responses to changes in the exponential population carrying capacity determined by the moisture and temperature time series (Fig. 2 A and B).

