Fig. 1.
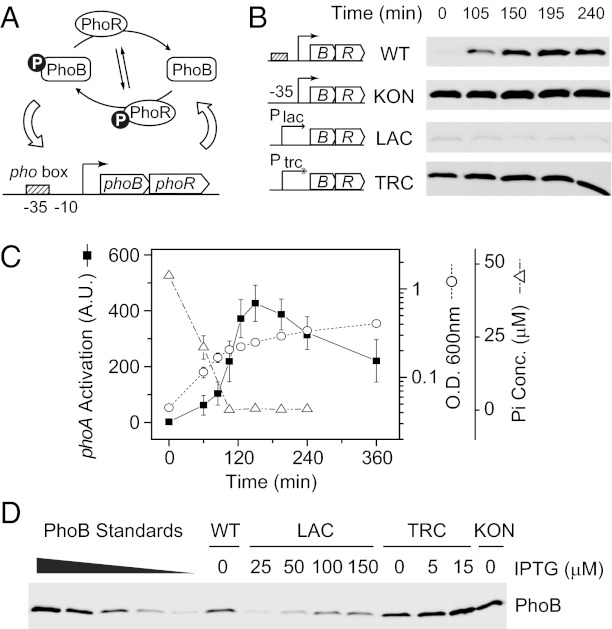
Quantification of PhoB expression. (A) Autoregulation of the PhoR/PhoB system. PhoR autophosphorylates and modulates the phosphorylation of PhoB with its phosphotransferase and phosphatase activities. Phosphorylated PhoB binds to the pho box and activates the transcription of phoBphoR. (B) Time-dependent expression of PhoB upon phosphate starvation. Nonautoregulated strains KON (RU1617), LAC (RU1616), TRC (RU1618), and autoregulated wild type (BW25113), were grown in Mops media starting with 50 μM Pi. Aliquots were taken at indicated times and analyzed by Western blot with anti-PhoB antisera. (C) Phosphate starvation responses of wild type. Phosphate concentration (open triangles), OD600 (open circles), and PhoB-regulated phoA activation (solid squares) were monitored during the growth of E . coli BW25113. Decrease of the Pi concentration below the detection limit accompanies the change of growth rate and the rise of AP activity. Error bars represent SDs from at least three independent experiments and unseen error bars are smaller than the symbols. (D) Quantitative Western analyses of PhoB expression. Indicated E. coli strains were grown under different IPTG concentrations and assayed for PhoB expression. Pure PhoB proteins were added to lysates of ΔphoBR cells as standards. The displayed Western blot shows only a representative subset of samples; the rest of the quantification is shown in Table S1.

