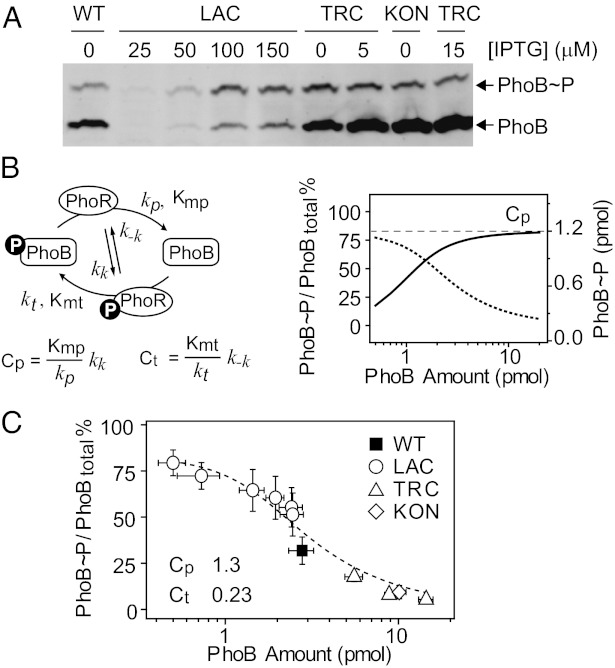
Fig. 3.
In vivo phosphorylation of PhoB at Pi-depleted conditions. (A) Saturation of PhoB phosphorylation analyzed with Phos-tag gels. Indicated strains and IPTG concentration were used to achieve different expression levels. Additional samples and standards are shown in Fig. S5. (B) Model of the PhoR/PhoB phosphorylation cycle. (Left) Four reactions were modeled, including autophosphorylation and dephosphorylation of PhoR, and PhoR-mediated phosphotransfer and dephosphorylation of PhoB. Cp and Ct constants define the relationship between PhoB∼P and total PhoB concentration. (Right) Steady-state PhoB∼P level (solid line) saturates at the value of Cp (dashed line), giving continuously decreased PhoB∼P fractions (dotted line). (C) Dependence of PhoB∼P percentages on total PhoB levels. Percentages of phosphorylation were quantified with PhoB∼P standards. The dashed line indicates the best fit of all data points. Error bars are SDs of at least three independent experiments, and unseen error bars are smaller than symbols.

