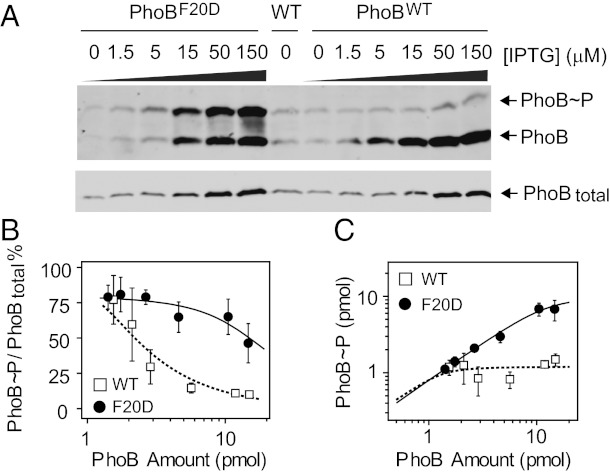
Fig. 4.
In vivo comparison of PhoBWT and PhoBF20D. (A) Phosphorylation of PhoBWT and PhoBF20D at Pi-depleted conditions. Strain RU1621 carrying pRG298 (Plac-phoBF20DphoR) or pRG226 (Plac-phoBWTphoR), and the wild-type strain BW25113 (WT) were analyzed with Phos-tag gels (Upper) and normal SDS gels (Lower). (B and C) Comparison of phosphorylation percentages (B) and levels (C) of PhoBWT and PhoBF20D. Phosphorylation percentages were quantified for plasmid-expressed PhoBWT (open squares) and PhoBF20D (solid circles), respectively. Phosphorylation levels were calculated as the product of phosphorylation percentages and total PhoB amount. The solid line indicates the best fit of the PhoBF20D data with a Cp of 10 ± 1.8 pmol and a Ct of 2.3 ± 0.8 pmol. The dotted line is a simulated curve for PhoBWT with a Cp of 1.2 pmol and a Ct of 0.1 pmol. Error bars are SDs from three independent experiments, and unseen error bars are smaller than symbols.

