
Fig. 5.
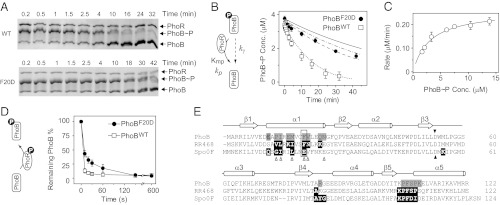
In vitro comparison of PhoBWT and PhoBF20D. (A) Dephosphorylation of PhoBWT (Upper) and PhoBF20D (Lower) by PhoRcyt. Phosphorylated PhoB proteins were incubated at room temperature with 0.5 μM PhoRcyt and 3 mM ADP to initiate dephosphorylation (SI Text). Initial concentrations of PhoB∼P were as follows: PhoBWT∼P, 3.4 μM; PhoBF20D∼P, 3.7 μM. (B) Time course of PhoB dephosphorylation by PhoRcyt. Concentrations of phosphorylated PhoBWT (open squares) and PhoBF20D (solid circles) were calculated from phosphorylation percentages and total PhoB amount. The solid line represents the autodephosphorylation curve calculated from a single exponential decay with the initial concentration of PhoBF20D∼P and experimentally determined decay constant kγ. The dotted line is an ODE simulation of PhoBWT dephosphorylation with following parameters: Km, 3 μM; kp, 0.0087 s−1; kγ, 2.6 × 10⁻⁴ s−1. The dissociation rate constant of the PhoB∼P and PhoR complex was assumed to be 0.1 s−1 and its variation was found to have little effect on simulated curves as long as Km was maintained at the same value (SI Text). The dashed and dash-dotted lines represent ODE simulations of PhoBF20D dephosphorylation with different sets of phosphatase parameters: dashed line, Km, 25 μM, kp, 0.0087 s−1; dash dotted line, Km, 3 μM; kp, 0.001 s−1. (C) Dependence of initial dephosphorylation rates on PhoB∼P concentrations. Initial rates were calculated from data within the first 5–10 min of dephosphorylation. The data were fitted to a rectangular hyperbola (solid line) with the Km at 3.0 ± 0.4 μM and Vmax at 0.26 ± 0.01 μM·min−1. kp was derived from dividing the Vmax by the PhoR concentration at 0.5 μM. (D) Phosphotransfer to PhoBWT (open squares) and PhoBF20D (solid circles). Approximately 3 μM of PhoR∼P was incubated with 2 μM of PhoB to initiate phosphotransfer. The remaining unphosphorylated PhoB amount was quantified to compare the extent of phosphotransfer. Error bars are SDs from two to three independent experiments, and unseen error bars are smaller than symbols. (E) Sequence alignment of PhoB with RR468 and Spo0F. Structures of HSK–RR or HPt–RR complexes have been solved for RR468 and Spo0F (27, 30). Secondary structural elements are shown above the alignment. The dark triangles highlight the conserved phosphorylation site, and the open triangles mark residues that are suggested to be important for HSK–RR interaction specificity (28). The gray shaded residues are involved in formation of the alternative PhoB dimer (24), and the black shaded residues are the RR residues that contact the HSK or HPt proteins.