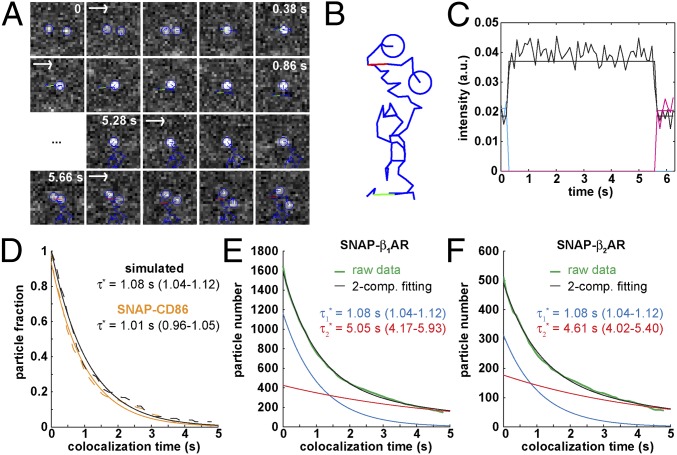
Fig. 3.
Dynamic visualization of receptor–receptor interactions. (A) Example of two Alexa647-labeled β1AR particles showing a transient colocalization. A merging event (green) is followed after some frames by a splitting event (red). Images are centered on the particles’ position. (Scale bar, 1 μm.) (B) Same traces as in A on a white background and without centering. (C) Intensity profiles of the traces in A, showing intensity doubling upon merging. (D) Colocalizations between control particles devoid of true interactions. Black, simulated particles with diffusion coefficients, intensity distribution, and bleaching rate analogous to those of β1AR particles. Orange, monomeric SNAP-CD86 receptors. The apparent lifetime of particle colocalizations ( ; 95% confidence intervals in parentheses) was calculated by fitting colocalization time data with an exponential decay function. (E) Lifetime of β1AR colocalizations. Colocalization time data derived from experiments as in A (green) were fitted to the sum (black) of two exponential decays (blue and red, respectively). The obtained apparent lifetimes of particle colocalizations (
 and
and  ; 95% confidence intervals in parentheses) were then used to estimate the true lifetime of receptor–receptor interactions. (F) Same as E with low-density (<0.35 particle/μm2) β2AR movies. Data in E and F are from 20 and 8 different cells, respectively. Data in E and F were fitted better with two components than with one, as judged by an F-test (P < 1.0 × 10⁻⁸).

