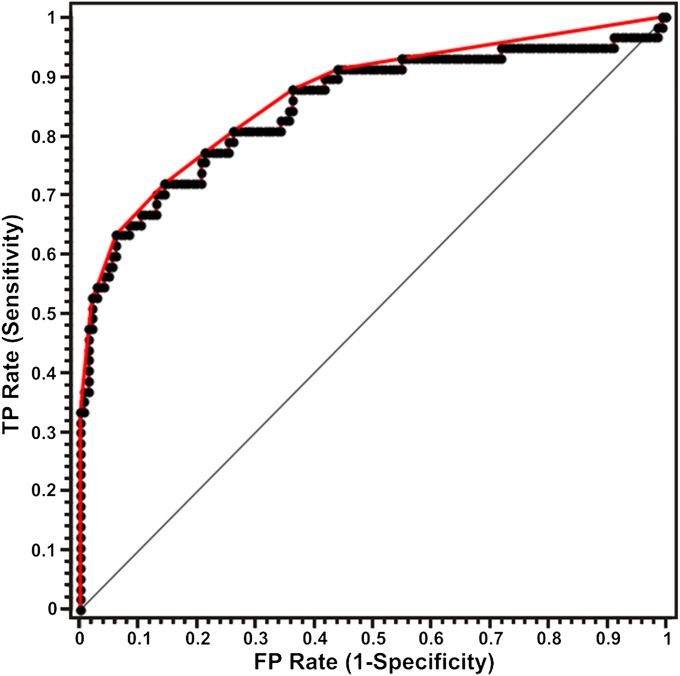
Fig. 5.
ROC curve for support vector machine-derived Raman algorithm for the diagnosis of breast lesions with microcalcifications. The ROC curve in red plots sensitivity versus (1-specificity) for the SVM decision algorithm as the discrimination threshold is varied. The ROC curve of two indistinguishable classes is represented by the solid black line. The area under the curve is 0.86, which is lower than that for the diffuse reflectance algorithm (0.88) (TP = true positive; FP = false positive).

