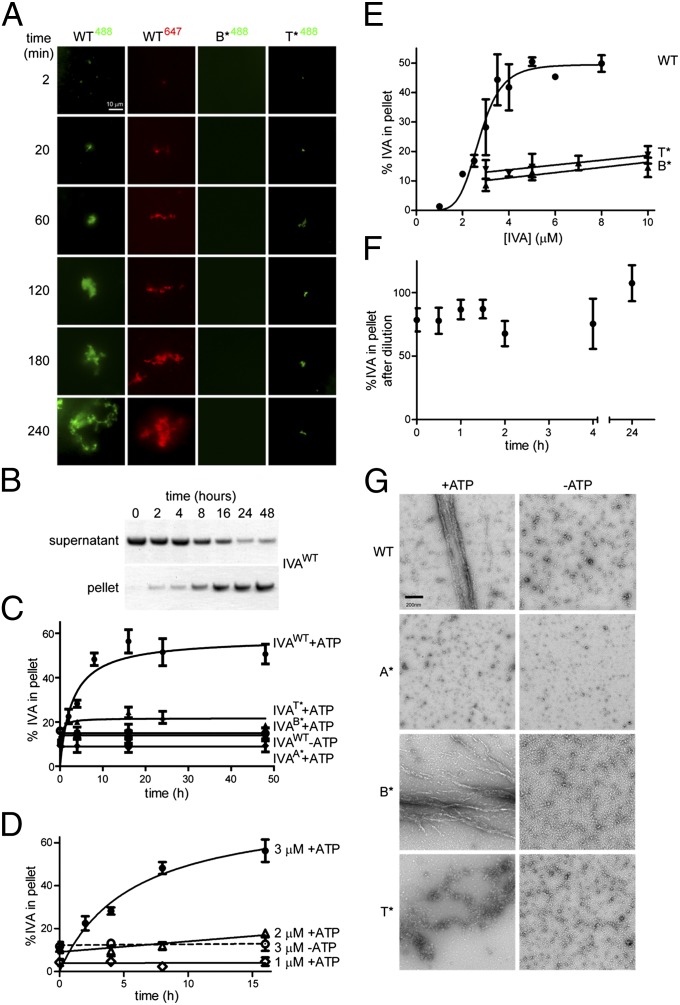
Fig. 2.
ATP hydrolysis drives the self-assembly of static IVA polymers. (A) Purified WT IVA labeled with Alexa 488 (first column) or Alexa 647 (second column) and IVAB* or IVAT* labeled with Alexa 488 (third and fourth columns, respectively) were incubated with ATP, and accumulation of polymerized insoluble material on the surface of the slide over time was monitored using TIRF microscopy. (B) Representative Coomassie-stained polyacrylamide gel of supernatant and pellet fractions of purified IVA incubated in the presence of ATP after centrifugation of aliquots at different indicated time points to monitor polymerization. (C) Kinetic analysis of polymerization of various IVA variants (●, WT; ♦, IVAA*; ■, IVAB*; ▲, IVAT*) in the presence of ATP or WT IVA in the absence of ATP (○) measured by centrifugation. (D) Polymerization of IVA is concentration-dependent. A total of 1 μM, 2 μM, or 3 μM purified IVA was incubated with or without ATP, and polymerization was measured over time by centrifugation. (E) Critical concentration for IVA polymerization. Varying concentrations of purified IVA, IVAB*, or IVAT* were incubated with ATP for 16 h, and polymerization was measured by centrifugation. Data for IVA polymerization were fit using the Hill model. (F) Polymerized IVA is largely static. Purified IVA (3 μM) was incubated for 16 h with ATP. Analysis of a parallel reaction indicated that about 50% of the total IVA had polymerized by this time (this value was set as 100% polymerized at t0). The reaction was then diluted threefold to below the threshold concentration for polymerization (final concentration of 1 μM), and samples of the reaction were centrifuged at the indicated time points to measure the amount of polymerized IVA in the pellet after dilution, normalized against the amount of polymerized IVA before dilution. All symbols represent mean values of three to four independent measurements; error bars represent SEM. (G) Transmission electron micrographs of purified IVA variants after incubation in the presence (Left) or absence (Right) of ATP. (Scale bar: 200 nm.) A*, B*, disruption of Walker A or Walker B motif, respectively; T*, disruption of sensor threonine (Thr).

