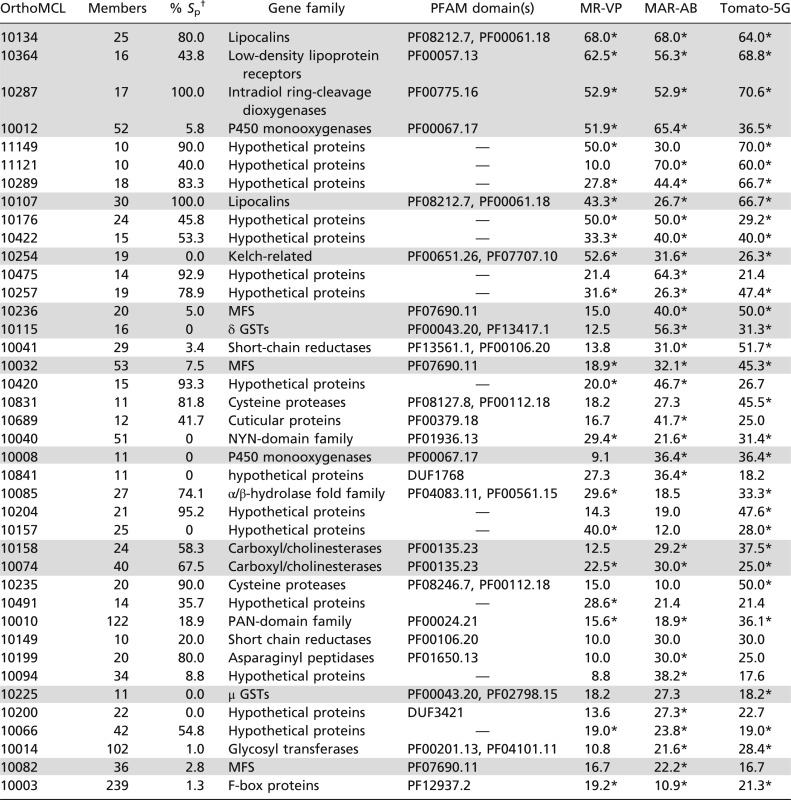
Table 1.
Extent of gene expression changes within gene clusters
 |
Gene clusters are as defined by OrthoMCL clustering. Percentages of genes differentially expressed within each OrthoMCL cluster in MR-VP, MAR-AB, and Tomato-5G are shown. Only shared OrthoMCL clusters (≥10 genes) where at least 20% of members are differentially expressed in MR-VP, MAR-AB, or Tomato-5G are shown. Gene family names have been linked to OrthoMCL clusters when possible. Many clusters consist of proteins with no PFAM hits (hypothetical proteins). OrthoMCL clusters are sorted on the basis of the average of the percentage of differentially expressed genes within each OrthoMCL cluster across MR-VP, MAR-AB, and Tomato-5G. For each OrthoMCL cluster the percentage of genes predicted with a signal peptide was calculated using SignalP 3.0 (115). Clusters mentioned in this study are shaded in gray.
*OrthoMCL clusters with an EASE (modified Fisher’s exact P value) score <0.05 (107).
†Percentage of gene members predicted with a signal peptide using SignalP 3.0 (115).
