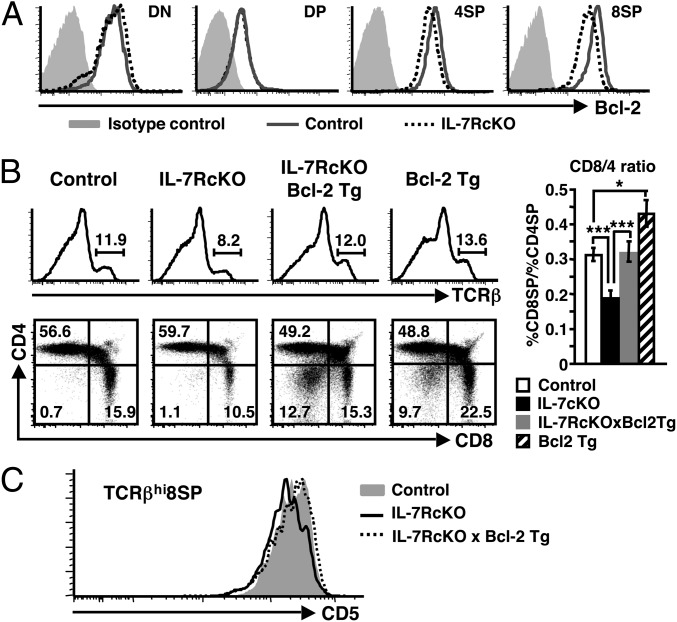
Fig. 3.
IL-7R transmits survival signals in CD8SP thymocytes through Bcl-2. (A) Expression of Bcl-2 in thymocyte fractions. 4SP and 8SP indicate TCRβhiCD25−Foxp3−CD4SP and TCRβhiCD8SP, respectively. Data represent five independent experiments with similar results. (B) Histograms (Upper) indicate expression of TCRβ in total thymocytes from mice of each genotype. Dot plots (Lower) show CD4 and CD8 expression in TCRβhi thymocytes. Bar graph (Right) shows the ratio of CD8SP to CD4SP cells in TCRβhi thymocytes (mean ± SEM, n = 8–11). (C) CD5 expression in TCRβhiCD8SP thymocytes from indicated mice. Data represent four independent experiments with similar results.

