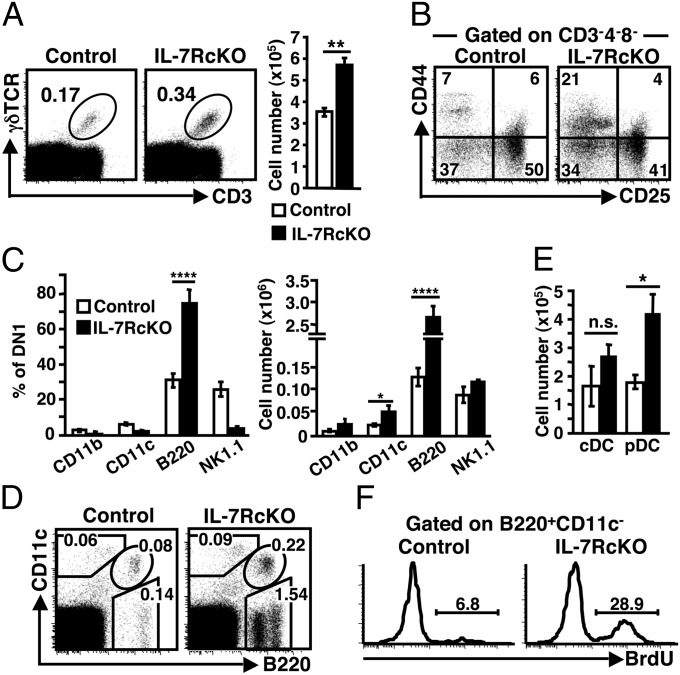
Fig. 6.
IL-7RcKO mice show increased numbers of γδ T cells, B cells, and DCs in thymus. (A) Dot plots (Left) show CD3 and γδTCR expression in thymocytes. Bar graph (Right) indicates the absolute numbers of CD3+γδTCR+ cells (mean ± SEM, n = 14). (B) Expression of CD44 and CD25 in CD3−CD4−CD8− thymocytes. Representative data are shown (n = 11). (C) Expression of CD11b, CD11c, B220, and NK1.1 in CD3−CD4−CD8−CD44+CD25− DN1 cells was analyzed by flow cytometry. Percentages (Left) and absolute cell numbers (Right) of each marker positive population are shown (mean ± SEM, n = 7). (D) B220 and CD11c expression of thymocytes isolated with collagenase. Data represent six independent experiments with similar results. (E) Absolute numbers cDC (B220−CD11c+) and pDC (B220+CD11c+) (mean ± SEM, n = 6). (F) BrdU incorporation by B220+CD11c− B lineage cells 24 h after treatment. Data represent four independent experiments with similar results.

