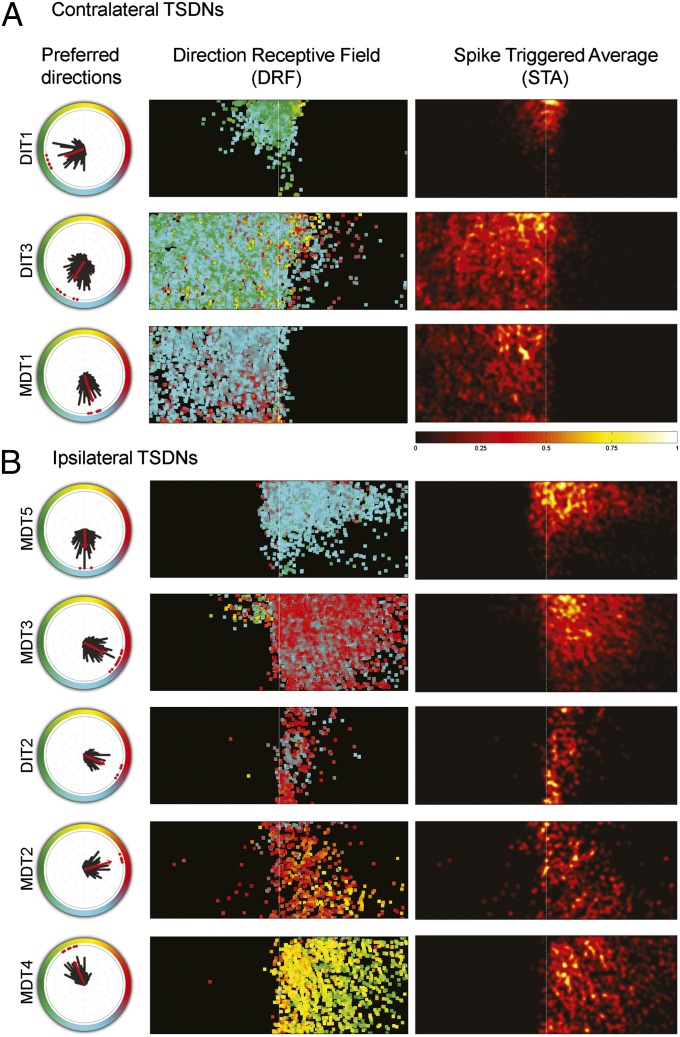
Fig. 2.
Each TSDN type shows a unique direction tuning curve and receptive field consistent across animals. (A) Contralateral and (B) ipsilateral TSDN receptive fields whose axons were in the right connective of the ventral nerve cord (VNC). The polar plots show the directional preference of each recorded TSDN (red dots) and their mean direction tuning distribution (black bars). The red arrow indicates mean preferred direction. The color-coded direction receptive field (DRF) maps show the mean direction preference at each pixel, which was calculated by averaging the direction peak, at each pixel, for all recordings of each TSDN type. In addition, spike-triggered average (STA) maps are shown for each TSDN type. Note that, because number of spikes was normalized before and after computing the average, the same scale applies to all STA maps.

