Fig. 1.
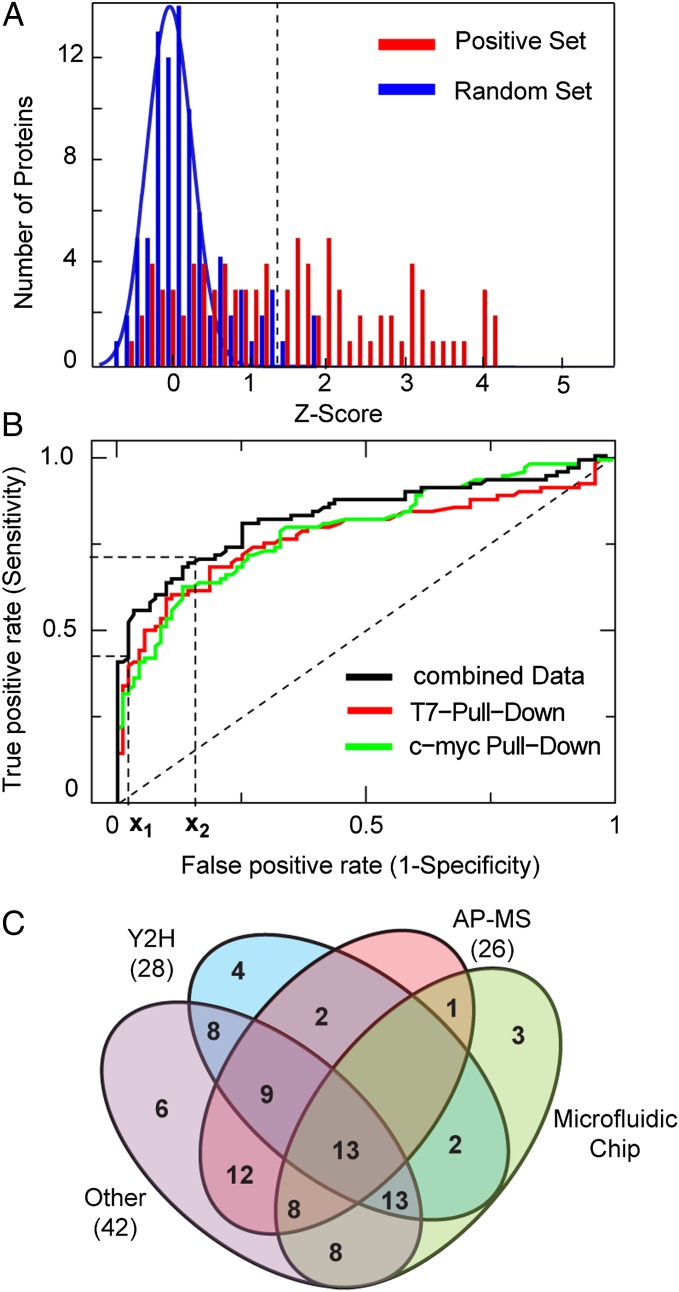
Benchmark of the protein-interaction chip technology. (A) Histogram of the z-scores of the random and positive benchmark set obtained from on chip protein-interaction measurements. The blue line is a Gaussian fit to the z-scores of the random set (r = 0.91). The dotted line defines the cutoff value obtained from the x1 value in B. (B) The receiver operator curves for protein-interaction measurements with different pull-down antibodies (reverse bait/prey order) and the combined dataset. x1 and x2 denote the high specificity cutoff level and the value for the error determination, respectively. (C) Comparison of the microfluidic chip to established interaction technologies based on the benchmark set. The Venn diagram shows the number of protein interactions from the benchmark set positively identified by the Y2H, AP-MS, other techniques and the microfluidic chip technology. Numbers in brackets denote the overlap between the microfluidic chip technology with corresponding techniques.

