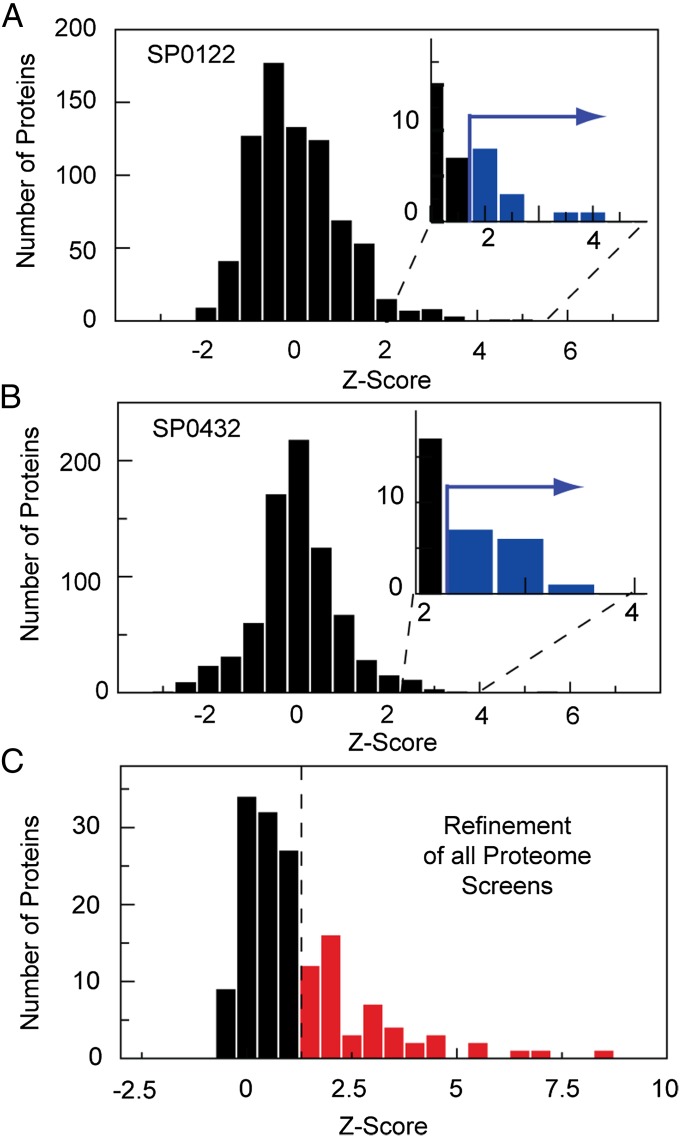
Fig. 3.
Proteome-wide protein–protein interaction screens. (A and B) The histogram of the z-score distributions obtained for the protein interaction measurement on chip between the Streptococcus pneumonia proteome set with cmyc/His tag against the unknown conserved proteins SP0122 and SP0432, respectively. Measurements were performed unidirectionally. (Insets) The z-scores for the top ∼1% of interactions, which were selected for refinement measurements. (C) The histogram of the mean z-score distribution of the top ∼1% of identified protein interactions from all performed proteome-wide screens repeated in bidirectional order with four repeats. The dotted line shows the cutoff value determined from the benchmark set.

