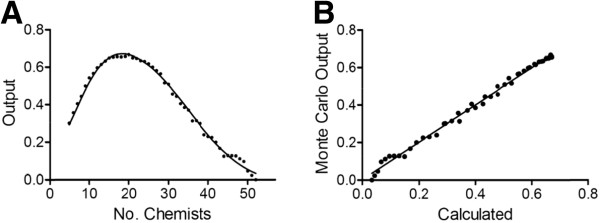
Figure 10.

(A) Monte Carlo simulation output values extracted from the diagonal of Figure8(points). Output from Equation 6 (solid line). Under the simulation conditions, maximum output occurs with 18 chemists. (B) Output from Equation 6 versus Monte Carlo simulation output values extracted from the diagonal of Figure 8 with linear regression line (r2 = 0.99).
